
Founder of LearnDataSci
10 Best Python Courses According to Data Analysis (as of 2022)
Out of roughly 3000 offerings, these are the best Python courses according to this analysis.
LearnDataSci is reader-supported. When you purchase through links on our site, earned commissions help support our team of writers, researchers, and designers at no extra cost to you.
Diverging from my data science course and machine learning course articles, where I make personal recommendations, I wanted to see if there's a way to find the best Python courses using data analysis reliably.
This article aims to use similar data and ranking metrics present in the early Google search algorithm.
TL;DR
Out of roughly 3000 offerings, these are the best Python courses according to this analysis:
- Learn Python by Codecademy
- Introduction to Python Programming by Udacity
- Programming for Everybody (Getting Started with Python) by Coursera
- Introduction to Python for Data Science by Datacamp
- Complete Python Bootcamp From Zero to Hero in Python by Udemy
- Introduction to Computer Science and Programming Using Python by Edx
- An Introduction to Interactive Programming in Python (Part 1) by Coursera
- Machine Learning with Python by Coursera
- Intro to TensorFlow for Deep Learning by Udacity
- Learn to Program: The Fundamentals by Coursera
If you would like to skip the analysis and see course scores, breakdowns, and reviews, click here.
How to rank Python courses
Google-based the early architecture of their search engine on the simple idea that search results could rank web pages according to a PageRank algorithm, which scored web pages based on the quantity and quality of backlinks.
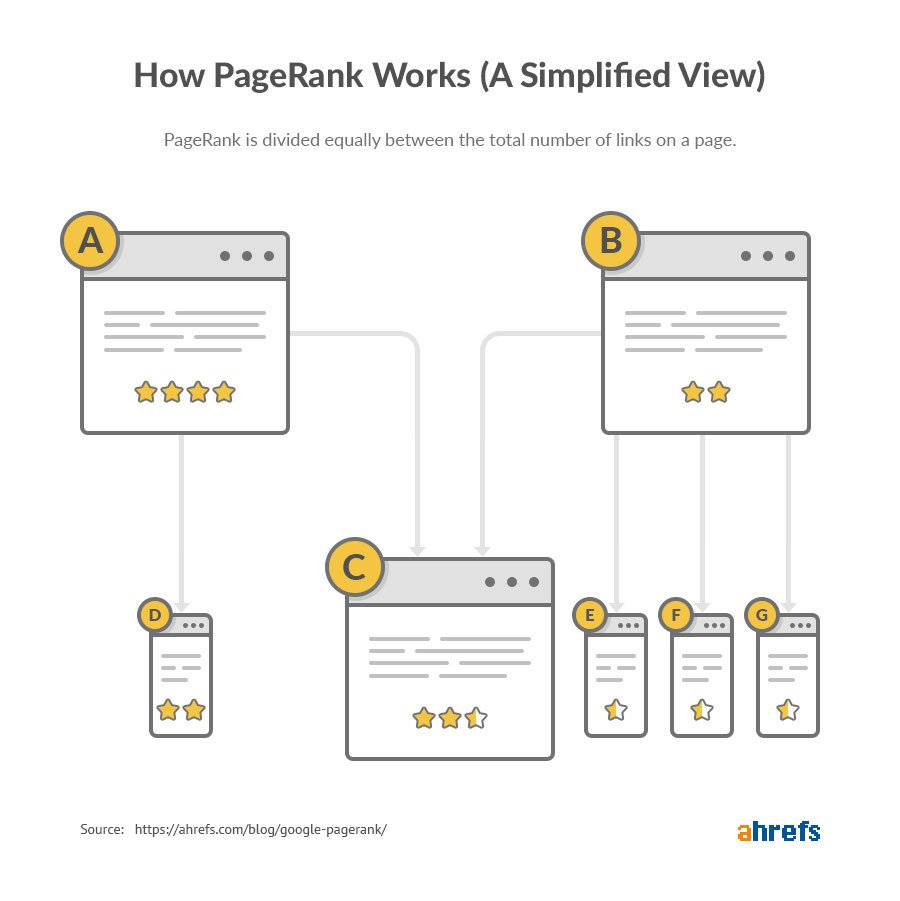
Web pages with many high PageRank backlinks should be more trustworthy. Google's algorithm has become a lot more complex since then, but I thought it would be interesting to apply this logic to Python courses.
If you are new to data analysis or Python, the code in this article might be challenging to follow. Taking one of the intro Python courses above should allow you to understand most of what's written below. This article will give you a glimpse into the various problems Python can solve!
Retrieving course platform data
Unfortunately, I don't have the resources to scan the entire Internet for links to courses. To get the required data, I'm using Ahrefs, an SEO analytics software, which crawls the web and stores website data as Google does. To find the top Python courses, I exported data from Ahrefs that corresponds to the Top Pages data from the following platforms:
I chose these platforms because they contain many Python courses, are well-known and trusted providers, and are highly trafficked. If I missed an important platform, please let me know in the comments below so I can update this analysis.
In Ahrefs, I used filters to find relevant course pages by searching for "Python" in the URL or top keyword for the page. Unfortunately, this may have included irrelevant courses while also missing a few courses because (1) it's possible that a Python course doesn't have "Python" in the URL and, (2) a course might not rank in a search engine for keywords containing "Python."
Additionally, I limited the pages to only those that show up in the top 50 search results on Google since I only have a basic Ahrefs plan and can't see data further than that.
Below is a short clip showing the process of finding courses using Ahrefs.
I exported each course platform into separate CSVs, which will need to be filtered even further to exclude certain irrelevant pages. Those filters will be detailed and applied later.
To give you an idea of what these CSVs look like, here's the header and first row of the Coursera CSV:
| # | Traffic (desc) | Traffic (Percent %) | # of Keywords | Referring Domains | URL | Top Keyword | It's Volume | Position | Page URL inside | Traffic value |
|---|---|---|---|---|---|---|---|---|---|---|
| 1 | 3247 | 25 | 136 | 182 | https://www.coursera.org/learn/machine-learning-with-python | python machine learning | 6600 | 2 | 16398 |
Here's what each column means:
- # - the row index from Ahrefs (we need to drop this in the next step).
- Traffic (desc), Traffic (Percent %) - this is the search engine traffic to this particular course page, as estimated by Ahrefs. The percentage indicates the share of all website traffic that goes to this specific page.
- # of Keywords - the number of unique keywords for which this page appears in search engines.
- Referring Domains - this is the primary metric of interest. The column states the total number of unique websites that link to the course page.
- URL - the URL of the course page
- Top Keyword, Its Volume - the keyword that gives the most traffic and by how much.
- Position - the position of this course page in search results when looking up the Top Keyword.
- Page URL inside - if the URL was found in one of Google's search features, such as a quote, featured snippet, "People also ask", etc.
- Traffic value - indicates how much the website would have to pay for ads to get the same traffic for the corresponding keyword(s).
Getting data into Python
We must first combine each CSV into a single data structure to perform an analysis using all platforms. Essentially, all data exploration and manipulation will be done using the pandas library (see our Python pandas tutorial for beginners). So, we'll first import pandas and pathlib, a library that provides tools for working with file paths:
import pandas as pd
from pathlib import PathI've named a folder ahrefs-courses to contain the CSVs for each course platform. The folder looks something like this:
ahrefs-courses
|___coursera.csv
|___edx.csv
|...We'll use pandas to read and concatenate all CSV data into one DataFrame object.
Below, we get all CSV files from the ahrefs-courses directory, make an empty DataFrame, and concat each file onto the DataFrame. Since each CSV has its own index, we need to reset_index to drop each one and make a new index for the combined dataframe.
dl_dir = Path('C:/users/brendan/downloads/ahrefs-courses')
# Getting all file paths in download directory
files = [f for f in dl_dir.iterdir()]
df = pd.DataFrame()
# Iterating over file paths and concatenating them to the dataframe
for file in files:
temp_df = pd.read_csv(file, encoding='utf8', thousands=',')
df = pd.concat([df, temp_df])
df.reset_index(drop=True, inplace=True)
df.head(1)| # | Traffic (desc) | Traffic (Percent %) | # of Keywords | Referring Domains | URL | Top Keyword | Its Volume | Position | Page URL inside | Traffic value | |
|---|---|---|---|---|---|---|---|---|---|---|---|
| 0 | 1 | 8035.0 | 31.0 | 638 | 196.0 | https://www.coursera.org/courses?query=python | coursera python | 3200 | 1 | NaN | 40291 |
Using df.head(1), we can see the first row of the newly combined dataframe. You can already notice a problem: the first course is a search result on Coursera, not an actual course. We'll see in the next section how to further filtering of URLs.
Filtering URLs
To further filter down the results into actual course pages, we'll need to use a few filters for each platform. I took some time looking through each platform to understand which URL structures corresponded to course pages, and made this dictionary of filters to use:
"""
Filters follow format:
platform_name: ([URL contains], [URL does not contain])
"""
filters = {
'coursera': (['/learn/', '/specialization/', '/projects/'], []),
'edx': (['/course/', '/xseries/', '/micromasters/', '/professional-certificate/'], ['/subject/']),
'udemy': (['/course/'], []),
'udacity': (['/course/'], []),
'pluralsight': (['/courses/', '/paths/'], []),
'datacamp': (['/courses/', '/tracks/'], []),
'dataquest': (['/path/', '/course/'], []),
'treehouse': (['/tracks/', '/techdegree/', '/learn/'], []),
'futurelearn': (['/courses/', '/experttracks/', '/microcredentials/', '/degrees/'], ['/info/']),
'linkedin': (['/learning/.+', '/paths/'], ['/topics/', '/browse/']),
'codecademy': (['/learn/', '/courses/'], [])
}The goal is to use this dictionary to filter the URL column in the dataframe. The dictionary's key is the platform name, which is also the platform's domain name, and the value is a tuple of requirements for the URL. The tuple contains two lists: (1) URL features to include, and (2) URL features to exclude.
For example, the main URL path for Linkedin Learning courses is linkedin.com/learning/, which we want to include. But we also want to exclude URLs like linkedin.com/learning/topics/. To filter these URLs, we can make sure '/learning/' is in the URL and '/topics/' is not.

To apply these filters to the URL column, I made the following functions:
apply_filters()- the function that is used directly withdf.apply(). Pandas passes each URL from the dataframe into this function, which will return the URL if it meets the criteria or None if it doesn't.make_regex()- theapply_filters()function finds the correct platform's filters and passes them to this function to create a regular expression (regex). For example, the regex for Codecademy URL inclusion filters would turn into "/learn/|/courses/", which is regex for find "/learn/" OR "/courses/" in the URL. Thedefault='$^'serves as a placeholder to skip matching if one of the filter lists is empty.
import re
def make_regex(filters: list):
default = '$^'
if filters:
default = re.compile('|'.join(filters))
return default
def apply_filters(url: str):
for name, filts in filters.items():
if name in url:
include = make_regex(filts[0])
exclude = make_regex(filts[1])
if re.search(include, url) and not re.search(exclude, url):
return url
return Noneprint(f"Original df length: {len(df)}")
df['URL'] = df['URL'].apply(apply_filters)
df.dropna(subset=['URL'], inplace=True)
print(f"Filtered df length: {len(df)}")Original df length: 8893
Filtered df length: 4413When the URL is filtered out, it's set to None by apply_filters(), allowing us to use dropna() on that column for removal.
Filtering our dataframe looks to have reduced the total number of URLs by about one-half.
In addition to filtering, we'll also filter entire columns since we only need Traffic, Referring Domains, and URL for this analysis.
Merging duplicate courses
We need to normalize URLs since the same course could be represented in multiple rows by having a slight URL variation. We will need to merge these where possible.
First, we need to normalize URLs by stripping protocol formats at the start of the URL. This is because http:// or https://, and with or without www. at the start of the URL, are all valid URLs for the same course.
Second, some course URLs represent a chapter or lesson inside the course. We can see an example of this on DataCamp and Linkedin Learning:

We want to strip off the ends to get the root course URL, then merge duplicate rows. Furthermore, we'll strip any paths past two forward slashes (/), not including the protocol, to get to the root course URL.
Here is a function we can apply to the URL column to perform these two normalizers:
def cut_url(url):
u = re.sub('https?://(www\.)?', '', url)
u_split = u.split('/')
u_join = '/'.join(u_split[:3])
return u_joinThe cut_url function will remove the protocol from the front of the URL using regex, split on forward slashes, then join only the first three URL chunks back together.
Using re.sub, which substitutes text, will replace "https://www." with an empty string. Since the URL could be "http" or "https" and may or may not have www., adding a question mark after the "s" and "www." will match all possibilities.
We'll need to apply this function to the URL column, then groupby URL to merge duplicates.
print(f'Length before: {len(df)}')
df['URL'] = df['URL'].apply(cut_url)
df = df.groupby('URL').agg('sum').reset_index()
print(f'Length after: {len(df)}')
df.head()Length before: 4413
Length after: 2854| URL | # | Traffic (desc) | Traffic (Percent %) | # of Keywords | Referring Domains | Its Volume | Position | Traffic value | |
|---|---|---|---|---|---|---|---|---|---|
| 0 | campus.datacamp.com/courses/ai-fundamentals | 1335 | 0.02 | 0.0 | 1 | 0.0 | 150 | 36 | 0 |
| 1 | campus.datacamp.com/courses/analyzing-iot-data... | 1052 | 0.10 | 0.0 | 3 | 0.0 | 250 | 31 | 0 |
| 2 | campus.datacamp.com/courses/analyzing-police-a... | 1586 | 0.00 | 0.0 | 1 | 0.0 | 150 | 42 | 0 |
| 3 | campus.datacamp.com/courses/analyzing-social-m... | 12269 | 0.23 | 0.0 | 26 | 0.0 | 440 | 276 | 0 |
| 4 | campus.datacamp.com/courses/analyzing-us-censu... | 11326 | 0.04 | 0.0 | 8 | 1.0 | 640 | 260 | 0 |
Using .agg('sum') on the groupby, the URL merging summed the Traffic and Referring Domains columns into one row. We have almost halved the number of courses again, but each row should now represent a unique course.
Visualizing Python course data
Extracting platform name
The first thing we might want to know is the number of courses per platform, so we'll first extract the platform's name from the URL and put it in a new column. If we split the URL on periods (.), we'll get a list like ['coursera', 'org/course-title'], where the platform name is at index 0.
Some URLs also have additional subdomains, like language codes. For example, https://ru.coursera.org is a Russian language subdomain on Coursera. We'll need to account for this when getting the platform name by seeing if the split on periods (mentioned above) results in a list longer than two.
We'll apply the following function to the URL column and assigning the result to a new column called Platform.
def extract_platform_name(url):
split_url = url.split('.')
if len(split_url) > 2:
return split_url[1]
return split_url[0]
# Extract platform name
df['Platform'] = df['URL'].apply(extract_platform_name)
df.head(1)| URL | # | Traffic (desc) | Traffic (Percent %) | # of Keywords | Referring Domains | Its Volume | Position | Traffic value | Platform | |
|---|---|---|---|---|---|---|---|---|---|---|
| 0 | campus.datacamp.com/courses/ai-fundamentals | 1335 | 0.02 | 0.0 | 1 | 0.0 | 150 | 36 | 0 | datacamp |
Since we have the platform name now, let's see how many Python courses we have for each platform.
Below is the code required to make a grouped bar plot, where the left axis is the number of Python courses on each platform, and the right axis is the amount of traffic those courses generate. We first need to make a new dataframe (grouped_df) which is grouped by Platform. Once grouped, we need to aggregate (.agg) the data we're interested in using. Using 'count' on the Platform column will gives us a count of courses on each platform, and using 'sum' on the Traffic column will sum up all traffic for each Platform.
import matplotlib.pyplot as plt
grouped_df = df.groupby('Platform').agg({'Platform': 'count', 'Traffic (desc)': 'sum'}).round(0)
fig, ax = plt.subplots()
x = np.arange(len(grouped_df))
width = 0.35
plt.title('Python Courses and Traffic per Platform')
rects1 = ax.bar(
x - width / 2,
grouped_df['Platform'],
width,
label='Total Courses',
color=next(ax._get_lines.prop_cycler)['color']
)
ax.set_ylabel('Python Courses')
ax.set_xticks(x)
ax.set_xticklabels(grouped_df.index, rotation=45)
ax2 = ax.twinx()
rects2 = ax2.bar(
x + width / 2,
grouped_df['Traffic (desc)'],
width,
label='Total Traffic',
color=next(ax._get_lines.prop_cycler)['color']
)
ax2.set_ylabel('Traffic')
fig.legend(bbox_to_anchor=(0.5, 0.9))
ax.bar_label(rects1, padding=3)
ax2.bar_label(rects2, padding=3)
fig.tight_layout()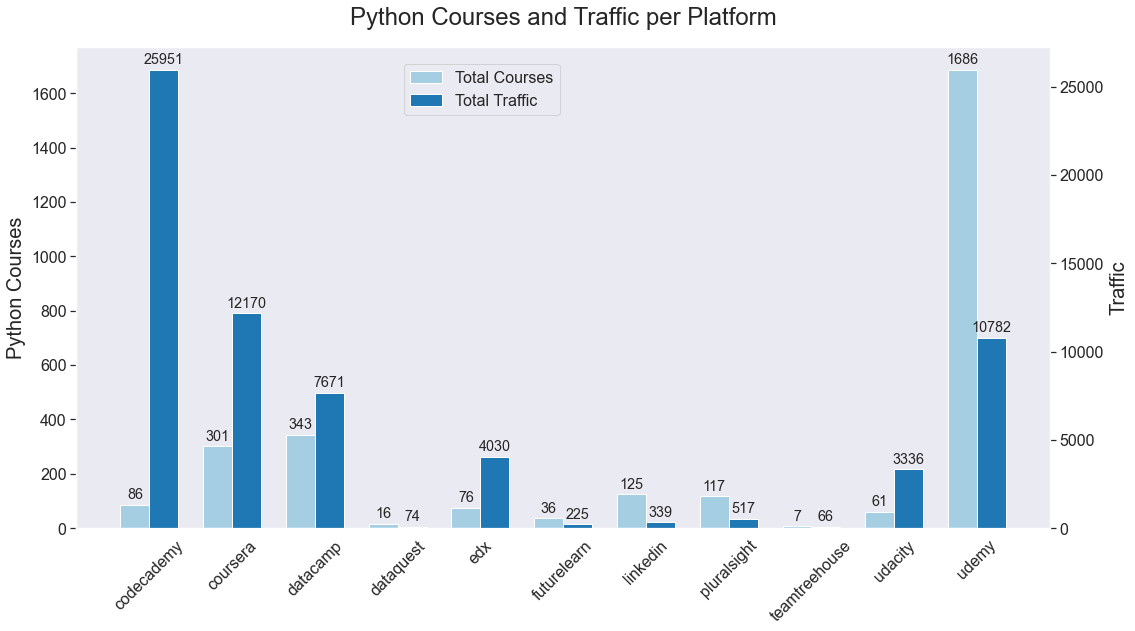
Udemy has significantly more Python-related courses than most other platforms, but Codecademy has the most traffic compared to its smaller number of offerings.
Ranking Python Courses by Referring Domains
I'm primarily interested in the popularity of a course page, as indicated by the number of unique links it gets. Accordingly, we will first sort by Referring Domains. The PageRank algorithm is more complex than just counting the number of links to a page, but I think this should be an interesting starting point for ranking Python courses.
Let's see the top 20 courses by number of unique referring domains:
df[['Referring Domains', 'URL']].sort_values('Referring Domains', ascending=False).head(10)| Referring Domains | URL | |
|---|---|---|
| 293 | 8054.0 | coursera.org/learn/machine-learning |
| 310 | 1949.0 | coursera.org/learn/python |
| 1149 | 1786.0 | udacity.com/course/introduction-to-python--ud1110 |
| 261 | 1495.0 | coursera.org/learn/cryptocurrency |
| 284 | 1429.0 | coursera.org/learn/interactive-python-1 |
| 1147 | 1390.0 | udacity.com/course/intro-to-tensorflow-for-deep-learning--ud187 |
| 997 | 1324.0 | pluralsight.com/courses/code-school-rails-for-zombies |
| 769 | 1322.0 | edx.org/course/introduction-to-computer-science-and-programming-7 |
| 202 | 1280.0 | codecademy.com/learn/learn-python |
| 347 | 1174.0 | coursera.org/learn/r-programming |
Since it's easier to look at plots, let's make a function that plots results in a horizontal bar plot so we can reuse the logic for the rest of the article.
To make sure the bar colors are the same across plots for each unique Platform, we'll first assign each Platform its own color:
palette = sns.color_palette()
platform_colors = {}
for name in list(df['Platform'].unique()):
platform_colors[name] = palette.pop()
platform_colors{'datacamp': (0.6941176470588235, 0.34901960784313724, 0.1568627450980392),
'codecademy': (1.0, 1.0, 0.6),
'coursera': (0.41568627450980394, 0.23921568627450981, 0.6039215686274509),
'edx': (0.792156862745098, 0.6980392156862745, 0.8392156862745098),
'dataquest': (1.0, 0.4980392156862745, 0.0),
'futurelearn': (0.9921568627450981, 0.7490196078431373, 0.43529411764705883),
'linkedin': (0.8901960784313725, 0.10196078431372549, 0.10980392156862745),
'pluralsight': (0.984313725490196, 0.6039215686274509, 0.6),
'teamtreehouse': (0.2, 0.6274509803921569, 0.17254901960784313),
'udacity': (0.6980392156862745, 0.8745098039215686, 0.5411764705882353),
'udemy': (0.12156862745098039, 0.47058823529411764, 0.7058823529411765)}Now, we'll create the horizontal bar plot function:
def get_barh(df, value_col: str, n_results: int, title: str):
sorted_df = df.sort_values(value_col).tail(n_results)
fig, ax = plt.subplots()
sns.barplot(
x=value_col,
y='URL',
data=sorted_df,
hue='Platform',
palette=platform_colors,
dodge=False,
linewidth=2,
edgecolor=".3"
)
plt.title(title)
plt.show()
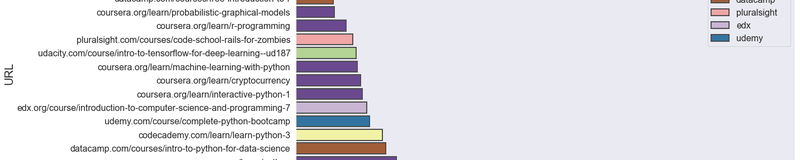
get_barh(df, 'Referring Domains', 10, 'Best Python Courses by Referring Domains')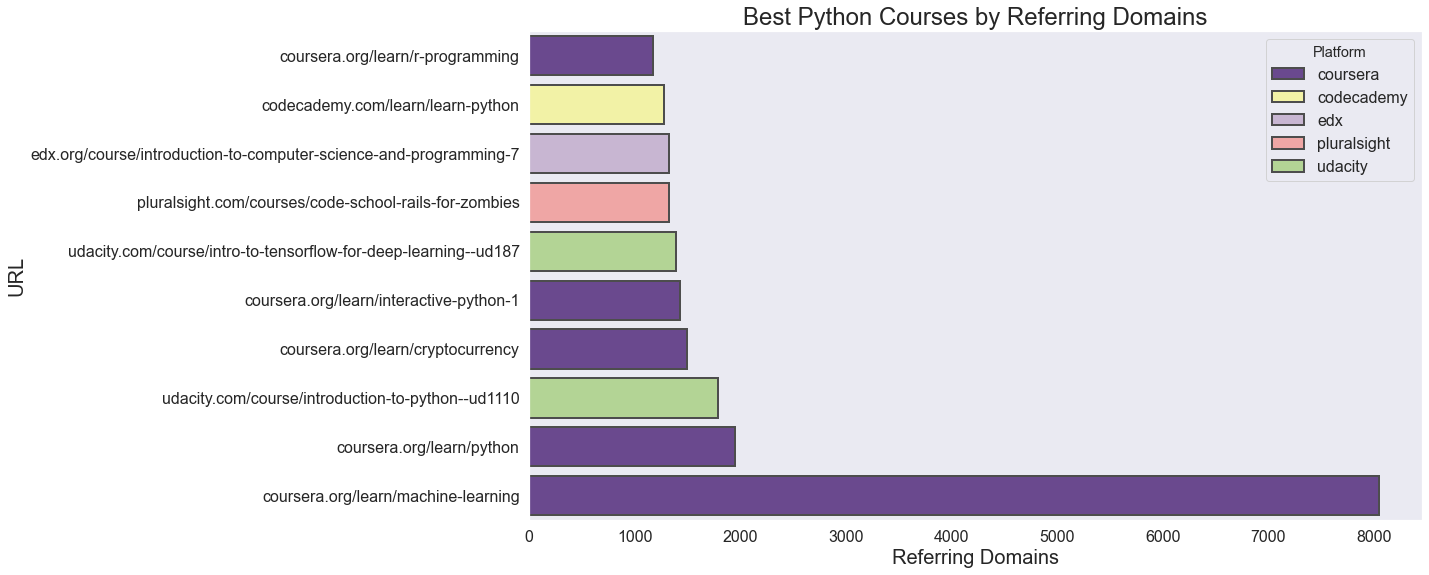
It looks like some non-relevant courses made their way into the top because of keywords frequently with Python. We can filters these out with the upcoming steps.
Ranking Python Courses by Traffic
We can also sort courses by traffic. Ahrefs estimates traffic by looking at keywords, Google positions, and traffic coming from backlinks. Let's look at that now.
get_barh(df, 'Traffic (desc)', 10, 'Best Python Courses by Traffic')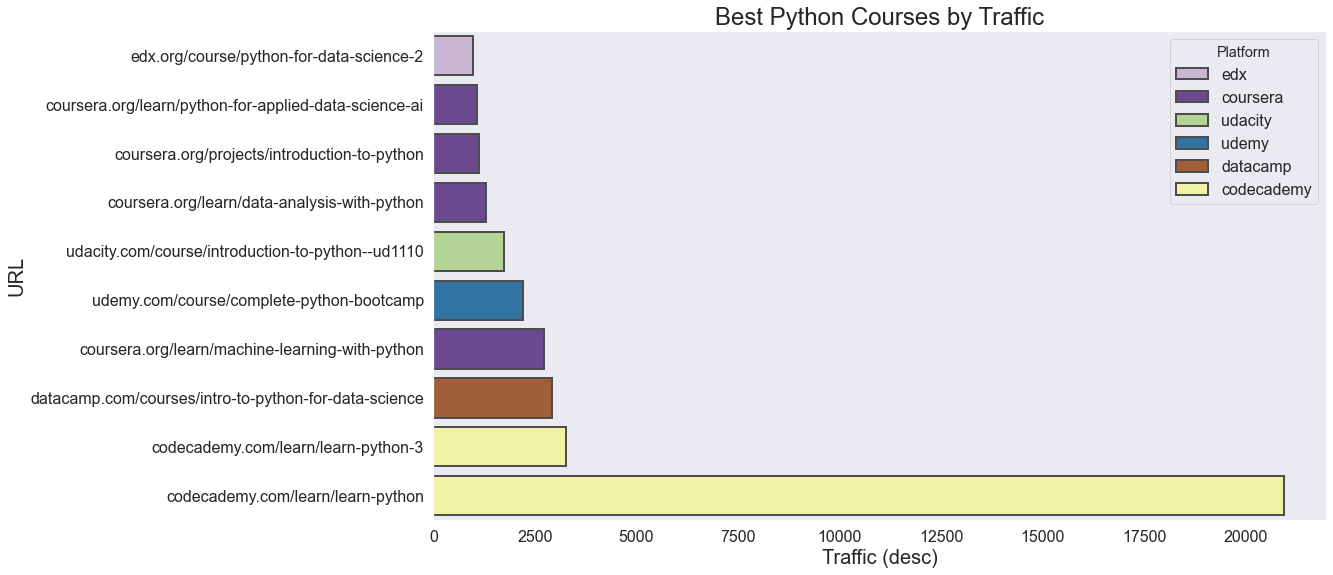
It looks like there has been a significant reordering when compare to referring domains, with Codecademy's Python course having a huge lead. Let's see which courses show up in high referring domains and high traffic.
Top Python Courses by Referring Domains and Traffic
We can filter both of the previous results to show which courses show up in both top lists. I'll expand the maximum results out to 20, so we can see more than just a couple of rows.
top_rd_df = df[['Referring Domains', 'URL']].sort_values('Referring Domains', ascending=False).head(20)
top_traff_df = df[['Traffic (desc)', 'URL']].sort_values('Traffic (desc)', ascending=False).head(20)
pd.merge(top_rd_df, top_traff_df, how='inner', on=['URL'])| Referring Domains | URL | Traffic (desc) | |
|---|---|---|---|
| 0 | 1949.0 | coursera.org/learn/python | 780.57 |
| 1 | 1786.0 | udacity.com/course/introduction-to-python--ud1110 | 1739.00 |
| 2 | 1322.0 | edx.org/course/introduction-to-computer-science-and-programming-7 | 689.00 |
| 3 | 1280.0 | codecademy.com/learn/learn-python | 20937.50 |
| 4 | 748.0 | datacamp.com/courses/intro-to-python-for-data-science | 2919.00 |
| 5 | 700.0 | udemy.com/course/complete-python-bootcamp | 2205.00 |
This result shows us that only a few records show up in the top referring domains and traffic, all of which are Python courses.
Suppose we use some simple feature engineering to create an interaction term between referring domains and traffic. In that case, it will allow us to rank courses by a single number that considers both features.
To create the interaction term, we'll compute the z-scores of Traffic (desc) and Referring Domains, then create a new column that's the average of the two z-scores.
Note
Z-scores prevent differences in magnitude/variance, giving more weight to one variable over another. Z-scores are defined as: $$\text{z-score} = \frac{X - \mu}{\sigma}$$ Where $X$ is each value, $\mu$ is the mean of data, and $\sigma$ is the standard deviation of the data.
Luckily, scipy has a z-score function for us. Let's first create a z-score column for traffic and referring domains, then create another column for the interaction term between the two.
First, for the zscore to output a real value, we need to drop any empty values in the two columns:
df.dropna(subset=['Traffic (desc)', 'Referring Domains'], inplace=True)Now, we can apply the z-score function to the two columns and create an interaction term:
from scipy.stats import zscore
# Creating z-scores
df['traffic_zscore'] = df[['Traffic (desc)']].apply(zscore)
df['rd_zscore'] = df[['Referring Domains']].apply(zscore)
# Interaction term by averaging z-scores
df['traffic_rd'] = (df['traffic_zscore'] + df['rd_zscore']) / 2We can now see which Python courses rank the highest according to this z-score interaction term.
We'll use the same horizontal bar plot function as before to visualize the difference in magnitude. Additionally, we'll plot 20 results since some high-ranking courses may not be about Python. We'll need to make a manual filter for the final results.
get_barh(df, 'traffic_rd', 20, 'Best Python Courses by Interaction Term')
plt.show()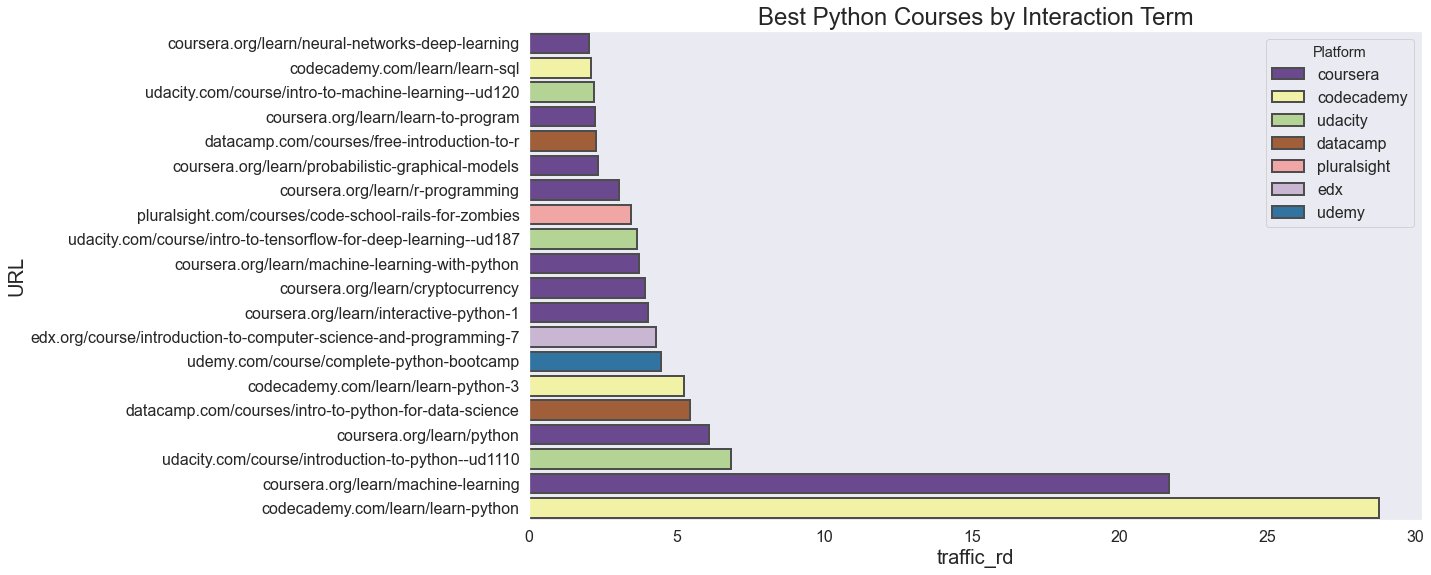
It appears that Codecademy's Learn Python course has beat out every other course, but Coursera's Machine Learning course is also far ahead of the pack. Unfortunately, since Coursera's course uses Octave instead of Python, it can't be included in the final top results.
From keeping track of the top courses since 2015 for the data science courses and machine learning courses pages, the Python courses shown above do match closely with what I have recommended.
We'll need to filter down these results to Python courses exclusively. Many in the top 20 use another programming language or no language, like in the cryptocurrency course.
After manual filtering, below is the final list of top Python courses according to our interaction term. Additionally, I joined each course to provide my overall impression of the platform and content to understand why it might be ranking so highly.
Course Breakdowns
Summary Table
| Course | Platform | Score | Level | Time to Completion | Certificate | Video | Quizzes | Projects | Interactive | Free option | Price | |
|---|---|---|---|---|---|---|---|---|---|---|---|---|
| 0 | Learn Python | codecademy | 35.733907 | Beginner | 30+ hours | ✔ | ✔ | ✔ | ✔ | ✔ | $19.99 | |
| 1 | Introduction to Python Programming | udacity | 8.717634 | Beginner | 4+ weeks | ✔ | ✔ | ✔ | Free | |||
| 2 | Programming for Everybody (Getting Started with Python) | coursera | 7.592760 | Beginner | 19+ hours | ✔ | ✔ | ✔ | ✔ | $49 | ||
| 3 | Introduction to Python for Data Science | datacamp | 7.180293 | Beginner | 4+ hours | ✔ | ✔ | ✔ | ✔ | $25 | ||
| 4 | Complete Python Bootcamp From Zero to Hero in Python | udemy | 5.850593 | Beginner | 22+ hours | ✔ | ✔ | ✔ | ✔ | $139.99 | ||
| 5 | Introduction to Computer Science and Programming Using Python | edx | 5.447137 | Beginner | 9+ weeks | ✔ | ✔ | ✔ | ✔ | $79 | ||
| 6 | An Introduction to Interactive Programming in Python (Part 1) | coursera | 5.066178 | Beginner | 19 hours | ✔ | ✔ | ✔ | ✔ | ✔ | ✔ | $49 |
| 7 | Machine Learning with Python | coursera | 4.828566 | Intermediate | 21 hours | ✔ | ✔ | ✔ | ✔ | ✔ | ✔ | $49 |
| 8 | Intro to TensorFlow for Deep Learning | udacity | 4.546392 | Intermediate | 8+ weeks | ✔ | ✔ | ✔ | Free | |||
| 9 | Learn to Program: The Fundamentals | coursera | 2.801397 | Beginner | 25+ hours | ✔ | ✔ | ✔ | ✔ | $49 |
1. Learn Python by Codecademy
Interestingly, the original URL ranked at the top of this analysis is Codecademy's course for Python 2, which you shouldn't start with since Python 3 supersedes Python 2. Fortunately, Codecademy has an updated version for Python 3, which I'll use instead for the following overview.
| Score: | 35.73 |
| Level: | Beginner |
| Time to completion: | 30+ hours |
| Certificate: | ✔ |
| Video: | |
| Quizzes: | ✔ |
| Projects: | ✔ |
| Interactive: | ✔ |
| Cost: | Free, \$19.99/month for Pro features |
| Course homepage | |
Overall impression:
The curriculum, lessons, quizzes, projects, and interactive platform make it obvious why Codecademy's course is a clear winner in traffic and referring domains.
The curriculum provides a solid foundation for solving problems with Python. Many fundamental topics are covered that are pivotal to writing basic Python programs but are often completely ignored by other courses.
One downside to this course for many people is that it's text-based, which means you'll learn Python through an interactive, in-browser editor with a written lesson on the side. If you learn better through video, you may want to consider the next Python course on the list.
2. Introduction to Python Programming by Udacity
After skipping Coursera's Machine Learning course, which you can see ranked in our machine learning course page, Udacity's Intro to Python Programming course comes in at the next highest rank. Even though it comes in as the second-highest Python course, it has over a 4x lower grade than Codecademy's.
| Score: | 8.72 |
| Level: | Beginner |
| Time to completion: | 4+ weeks |
| Certificate: | |
| Video: | ✔ |
| Quizzes: | ✔ |
| Projects: | |
| Interactive: | |
| Cost: | Free |
| Course homepage | |
Overall impression:
Despite this course's 4x lower rank, it still has a lot of value. For one, if you learn better through video, this course is a better choice since each lesson has a recorded lecture.
I'd say, overall, Codecademy's course is much better. There's much more attention paid to teaching you the way to write real programs.
3. Programming for Everybody (Getting Started with Python) by Coursera
This course is the first installment of the Python for Everybody specialization on Coursera, which consists of five different courses that bring you up to intermediate-level knowledge of Python. Taking this course will be a good starting point if you want a seamless transition to more advanced topics, such as working with data and databases.
| Score: | 7.59 |
| Level: | Beginner |
| Time to completion: | 19+ hours |
| Certificate: | ✔ |
| Video: | ✔ |
| Quizzes: | ✔ |
| Projects: | |
| Interactive: | |
| Cost: | Free, \$49/month for Certificate |
| Course homepage | |
Overall impression:
I found this course's videos are much more organized and entertaining than others on this list. The speed and difficulty level seems a bit low, which several reviews echoed.
The team behind this course did a great job creating a Python learning environment. Unique features, such as interviews with influential Python programmers, in-depth reading materials and books, office hours, and discussion forums, add to the immersion.
4. Introduction to Python for Data Science by Datacamp
DataCamp is an interactive platform, similar to Codecademy, but with videos incorporated into the course material. Since DataCamp's material focuses on data science, this Python course has a data science flavor.
| Score: | 7.18 |
| Level: | Beginner |
| Time to completion: | 4+ hours |
| Certificate: | |
| Video: | ✔ |
| Quizzes: | ✔ |
| Projects: | |
| Interactive: | ✔ |
| Cost: | Free for basics, \$25/month |
| Course homepage | |
Overall impression:
The free content you get with this course isn't much; it stops at variables, which is only the beginning of learning how to program. There are other options in this list that have more content for free.
With that said, if you are getting into Python specifically for data science and machine learning, subscribing to DataCamp and taking this course is a good start. If your learning style matches the Codecademy text-based lessons more closely, then consider checking out Dataquest instead.
5. Complete Python Bootcamp From Zero to Hero in Python by Udemy
Developed by Jose Portilla, this is probably the best Python course on Udemy. The instructor is a data scientist who's created many other data science-related courses, such as The Python for Data Science and Machine Learning Bootcamp, The Complete SQL Bootcamp 2021: Go from Zero to Hero, and Spark and Python for Big Data with PySpark.
| Score: | 5.85 |
| Level: | Beginner |
| Time to completion: | 22+ hours |
| Certificate: | ✔ |
| Video: | ✔ |
| Quizzes: | ✔ |
| Projects: | ✔ |
| Interactive: | |
| Cost: | \$139.99, but usually on sale for under \$30 |
| Course homepage | |
Overall impression:
I like the video format in this course, and it's similar to what I would do if I created a purely video-based Python course. The instructor starts lessons with slides that detail the essential parts of a Python feature, then hops into an interactive Jupyter notebook to demonstrate several different examples of using the new feature. Learning by being exposed to many examples is how I learn new subjects, so this course style works well.
One drawback is that the course does not expose you to coding Python in an actual project, which Udacity demonstrates in their modules. You can do a lot of data science work in Jupyter notebooks. Still, at some point, you need to create a project, organize several Python scripts in different folders, and run your solution from the command line or web interface. Developing projects is a fundamental skill to becoming a Python engineer.
6. Introduction to Computer Science and Programming Using Python by Edx
Taught by MIT, this course takes more of an academic, computer science approach to introducing Python.
Unlike the previous courses, you aren't just learning Python syntax; you're also learning about core CS concepts simultaneously.
| Score: | 5.45 |
| Level: | Beginner |
| Time to completion: | 9+ weeks |
| Certificate: | ✔ |
| Video: | ✔ |
| Quizzes: | ✔ |
| Projects: | |
| Interactive: | |
| Cost: | Free, \$79 for Verified Track |
| Course homepage | |
Overall impression:
The course mainly consists of academic-style video lectures, where the professor annotates slides for each Python concept. Occasionally, the lecturer hops into an interactive environment to demonstrate a concept, explain pitfalls, and provide more examples of use.
While the lectures are slightly dull, the lecturer does provide exceptional insight into Python programming and CS topics. This course would be a good starting point for someone interested in obtaining a more robust computer science foundation and learning Python. Additionally, the lack of interactivity means you'll need to be vigilant against just watching the videos and not working through each concept.
7. An Introduction to Interactive Programming in Python (Part 1) by Coursera
Course one of the 7-part Fundamentals of Computing specialization on Coursera. This course provides an alternative, more specific way to learn Python: creating of Graphical User Interfaces (GUIs) and games.
| Score: | 5.07 |
| Level: | Beginner |
| Time to completion: | 19 hours |
| Certificate: | ✔ |
| Video: | ✔ |
| Quizzes: | ✔ |
| Projects: | ✔ |
| Interactive: | ✔ |
| Cost: | Free, \$49/month for Certificate |
| Course homepage | |
Overall impression:
Because this course uses Python 2 instead of Python 3, I wouldn't recommend enrolling unless you're interested in working on GUIs in Python. It's not a big jump to go from Python 2 to 3, but if you're brand new and have other course options, it will be better to go straight to Python 3.
8. Machine Learning with Python by Coursera
Two Ph.D. data scientists at IBM created this course, which is part of two different programs on Coursera: (1) Data Science Professional Certificate and (2) AI Engineering Professional Certificate.
This course assumes you already have some Python experience and is geared entirely towards machine learning concepts.
| Score: | 4.83 |
| Level: | Intermediate |
| Time to completion: | 21 hours |
| Certificate: | ✔ |
| Video: | ✔ |
| Quizzes: | ✔ |
| Projects: | ✔ |
| Interactive: | ✔ |
| Cost: | Free, \$49/month for Certificate |
| Course homepage | |
Overall impression:
The curriculum hits on four core machine learning algorithms but doesn't introduce Python in a beginner-friendly way. You'll have to look to another course in this list for learning Python first. Otherwise, this course is a practical introduction to machine learning with Python. It doesn't make it into my best machine learning courses page, though, because the course doesn't demonstrate the mathematics behind the algorithms. However, it does include well-planned interactive Jupyter notebooks you can work through to completely understand each concept.
9. Intro to TensorFlow for Deep Learning by Udacity
This course helps software developers gain the skills necessary for applying deep learning models, such as Convolutional Neural Networks (CNNs). This course is not a course for learning Python but for learning how to use the Tensorflow Python library for machine learning tasks.
| Score: | 4.55 |
| Level: | Intermediate |
| Time to completion: | 8+ weeks |
| Certificate: | |
| Video: | ✔ |
| Quizzes: | ✔ |
| Projects: | |
| Interactive: | |
| Cost: | Free |
| Course homepage | |
Overall impression:
The lessons cover various machine learning concepts, like CNNs, NLP, time series forecasting, and transfer learning. I found the instructor and video format to be very well organized and insightful. Additionally, each topic ends with a Colab notebook that covers even more detail and teaches, which helps solidify new skills.
You should already be familiar with basic Python syntax and concepts, so one of the other beginner courses in this list, like Codecademy, is a prerequisite.
10. Learn to Program: The Fundamentals by Coursera
Taught by two University of Toronto professors, this beginner-level Python course teaches the basic syntax and concepts needed to make useful programs.
| Score: | 2.80 |
| Level: | Beginner |
| Time to completion: | 25+ hours |
| Certificate: | ✔ |
| Video: | ✔ |
| Quizzes: | ✔ |
| Projects: | |
| Interactive: | |
| Cost: | Free, \$49/month for Certificate |
| Course homepage | |
Overall impression:
Despite not having in-browser interactivity, the professors have a lot of teaching experience, which comes through in the organization and lecture quality. The instructor demonstrates each core Python concept using an IDLE, and walks through several examples of syntax and common problems you may encounter.
The curriculum falls a little short of what I would consider a complete beginner's course, but I'd still deem this course an excellent place to start since the professors provide clear explanations of each topic. Additionally, the quizzes and programming assignments help put each lesson into practice.
In Summary
Using Ahref's traffic and referring domains data, we've found the top ten courses from almost 3000 offerings across the world's largest online course platforms. Since Codecademy's course scored significantly better than any other offering, it's a safe bet to start your Python journey there.
No matter which course you take, make sure to tackle projects as often as possible. Find something you're interested in working on and keep programming until you have something that solves a problem. Show off your solution, use it to help others, and even make a career out of it. Using Python—and programming in general—to create value for yourself and others is a rewarding feedback loop that will keep you working, moving forward, and getting better.