
Data Scientist
How to Make an Algo Trading Crypto Bot with Python (Part 1)
How to backtest strategies and trade cryptocurrency with Python using freqtrade
LearnDataSci is reader-supported. When you purchase through links on our site, earned commissions help support our team of writers, researchers, and designers at no extra cost to you.
Part 1 (this article)
In this first part, you'll see:
- Freqtrade's basic functionality and crypto-market terms — We'll learn how freqtrade works, how to navigate the command-line tool to download historical market data, create a new configuration file, and a new strategy.
- How to define strategies using Python and pandas — We'll define a simple moving average strategy trading between Ethereum (ETH) and Bitcoin (BTC), trying to maximize the amount of Bitcoin we hold.
- Backtesting a strategy on historical data to determine our strategy's performance — We'll see how to generate full reports, as well as plots to visualize our bot's simulated trades.
Part 2 (next article)
In the second part, we'll go into more advanced topics, such as:
- Trading with more coin pairs
- Understanding and defining Return On Investment (ROI) and Stoploss
- Optimizing our strategies
- Live deployment
- Suggestions for further improvement
Note
Please be aware of freqtrade's disclaimer (paraphrased): "This software is for educational purposes only. Do not risk money which you are afraid to lose. USE THE SOFTWARE AT YOUR OWN RISK. THE AUTHORS AND ALL AFFILIATES ASSUME NO RESPONSIBILITY FOR YOUR TRADING RESULTS."
Always start by running a trading bot in a Dry-run and don't use real money until you understand how freqtrade works and the profit/loss you expect.
We strongly recommend you have basic Python knowledge so you can read the source code and understand the inner workings of the bot and the algorithms and techniques implemented inside. Consider enrolling in a course from our list of best python courses to improve your understanding before embarking on a trading bot.
This article is for educational purposes only, and we do not advise you to do anything with it. A trading bot comes with no guarantees, even if it does well on backtesting.
Basics of freqtrade
Freqtrade is a cryptocurrency algorithmic trading software written in Python.
It allows you to:
- Develop a strategy: easily using Python and pandas. We'll be creating a simple strategy in this article, and you can view freqtrade's example strategies repo).
- Download market data: quickly download historical price data of the cryptocurrency of your choice.
- Backtest: test your strategy on historical data. Backtesting is a critical step to see if your strategy has any chance of making money in the real world. It is not a guarantee for actual performance since market conditions are more complex than the downloaded data.
- Optimize: find the best parameters for your strategy with hyperopt.
- Select coin pairs to trade: your selection can be static or dynamic based on simple filters, such as if trading volume greater than a certain amount.
- Dry run: test a strategy on live data with a simulated wallet.
- Live run: deploy a strategy using real money via a crypto exchange's API. This is the last step after you know what you are doing and are willing to lose all your money.
- Use a Telegram Bot: control and monitor your strategies through Telegram.
- Analyze and visualize trading history: utilize trading data from save files or via an SQL database.
Installation of freqtrade
Ok, let's dive in by starting with the installation.
Docker - easiest method for all platforms
Docker is the quickest way to get started on all platforms and is the recommended approach for Windows. You will need to install Docker and docker-compose first, then make sure Docker is running by launching Docker Desktop.
You can now set up freqtrade by issuing the following commands in your desired directory:
mkdir ft_userdata
cd ft_userdata/
# Download the docker-compose file from the repository
curl https://raw.githubusercontent.com/freqtrade/freqtrade/stable/docker-compose.yml -o docker-compose.yml
# Pull the freqtrade image
docker-compose pull
# Create user directory structure
docker-compose run --rm freqtrade create-userdir --userdir user_dataYou should now have the following directory structure:
ft_userdata
└───user_data
├───backtest_results
├───data
├───hyperopts
├───hyperopt_results
├───logs
├───notebooks
├───plot
└───strategiesTo verify freqtrade is installed correctly and ready for use, issue the help command:
docker-compose run --rm freqtrade --helpYou should see the following output
usage: freqtrade [-h] [-V]
{trade,create-userdir,new-config,new-hyperopt,new-strategy,download-data,convert-data,convert-trade-data,list-data,backtesting,edge,hyperopt,hyperopt-list,hyperopt-show,list-exchanges,list-hyperopts,list-markets,list-pairs,list-strategies,list-timeframes,show-trades,test-pairlist,instal l-ui,plot-dataframe,plot-profit} ...The output of the help command shows all possible freqtrade commands. In this series, we are exploring the most important commands and how to use them. The first of which is backtesting.
Backtesting: How freqtrade tests trading strategies
In this article, we are looking to create a simple strategy and backtest on historical data. Backtesting tests the strategy on historical data, simulating the trades the strategy was expected to make. While this is not a guarantee for performance in the real world, it is a good indication of a winning/losing strategy.
Freqtrade backtests strategies through the following steps:
- Load historic data for coin pairs (ETH/BTC, ADA/BTC, XRP/BTC, etc) in the provided config file
- Call the strategy's
bot_loop_start()function once. This initiates a new loop in live runs, while in backtesting, this is needed only once. - Calculate the strategy's technical indicators by calling the
populate_indicators()method for every pair - Calculate buy/sell signals by calling the
populate_buy_trend()andpopulate_sell_trend()methods for every pair - Confirm buy/sell trades by calling the
confirm_trade_entry()andconfirm_trade_exit()methods if implemented in the strategy - Loop through each time period (5m, 1h, 1d, etc.) and simulate entry and exit points
- Finally, generate a backtest report, which summarizes all the trades and the associated profit and loss for the specified period
We'll define the methods mentioned above, such as populate_indicators(), in the upcoming paragraphs.
To learn more, be sure to check out the relevant documentation page. It is particularly well-written and easy to read.
Downloading Data
To perform backtesting, we need historical price data from an exchange. Let's start by downloading some data from Binance with the following command:
docker-compose run --rm freqtrade download-data -p ETH/BTC -t 1d --timerange 20200101-20201231 --exchange binanceThe command's arguments tell freqtrade the following:
-p ETH/BTC- Download data for the Ethereum (ETH) - Bitcoin (BTC) pair-t 1d- Download data that have a timeframe of 1 day--timerange 20200101-20201231- Download data from 01/01/2020 to 31/12/2020.--exchange binance- Download data from the Binance exchange. Here, you can use any exchange that freqtrade supports.
This command generated the file:
ft_userdata
└───user_data
└───data
└───binance
ETH_BTC-1d.jsonWhich contains multiple open-high-low-close-volume (OHLCV) data artifacts like the following:
| time | Open | High | Low | Close | Volume |
|---|---|---|---|---|---|
| 1622851200000 | 0.073013 | 0.075 | 0.0726 | 0.073986 | 143662.752 |
| 1622937600000 | 0.073989 | 0.075961 | 0.073626 | 0.075737 | 120623.423 |
Where the columns mean the following:
- time: Unix timestamp in milliseconds
- Open: Opening price at the beginning of the candlestick
- High: Highest price reached during the candlestick
- Low: Lowest price reached during the candlestick
- Close: Closing price at the end of the candlestick
- Volume: Quantity of asset bought or sold, displayed in base currency, in our case ETH. BTC is the quote currency.
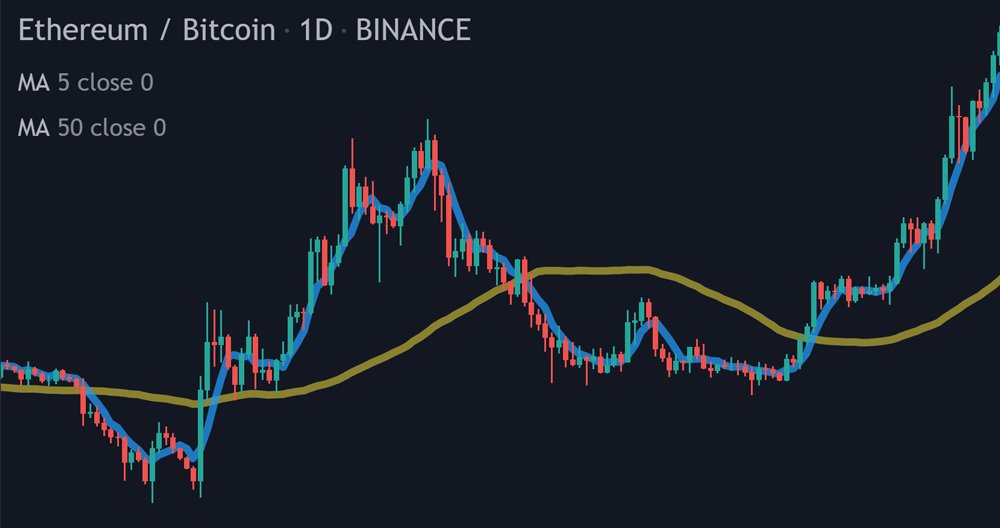
This data can be representing neatly in the following candlestick chart:
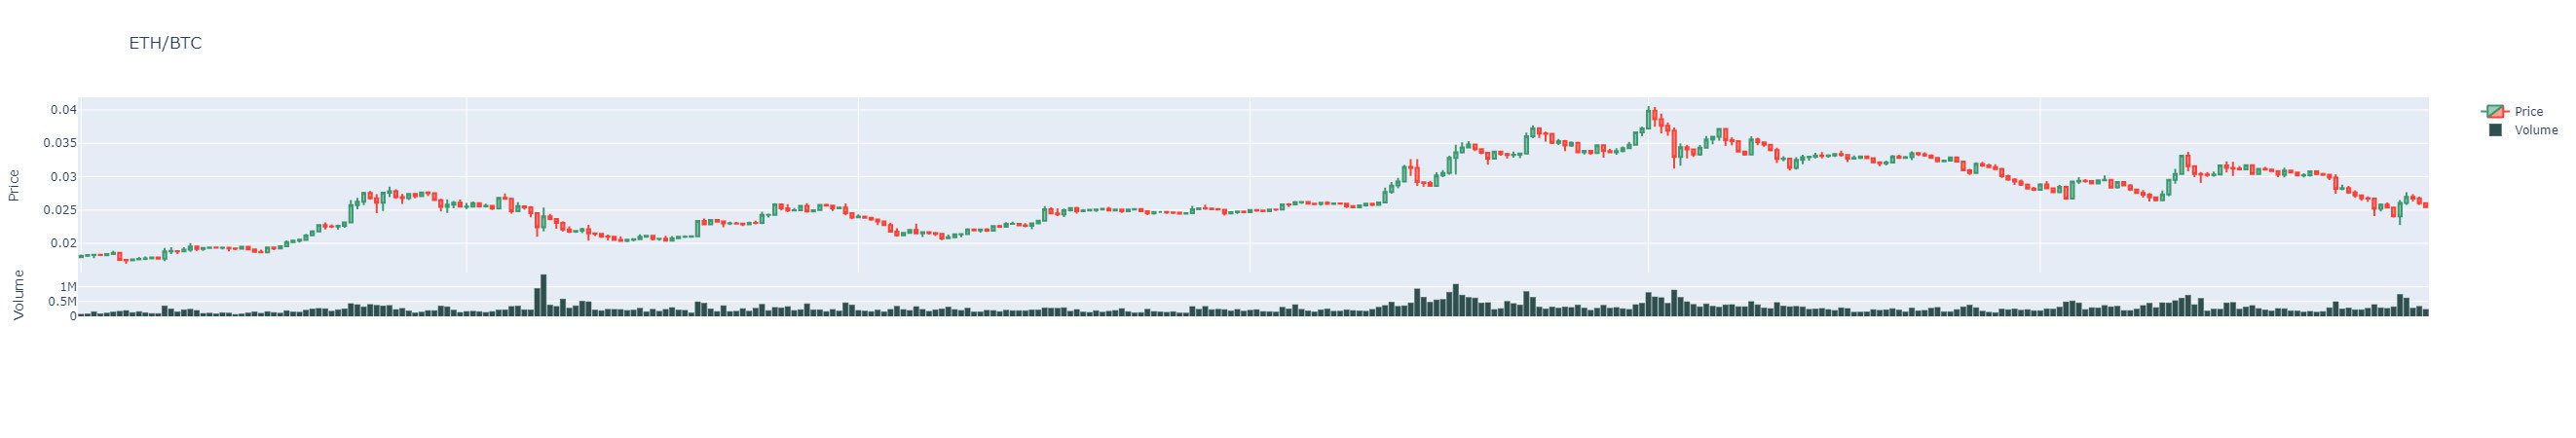
How to read the graph above
The chart above uses candlesticks to represent much more information than just a simple line. You can see a quick depiction of what candlesticks mean in the following image.
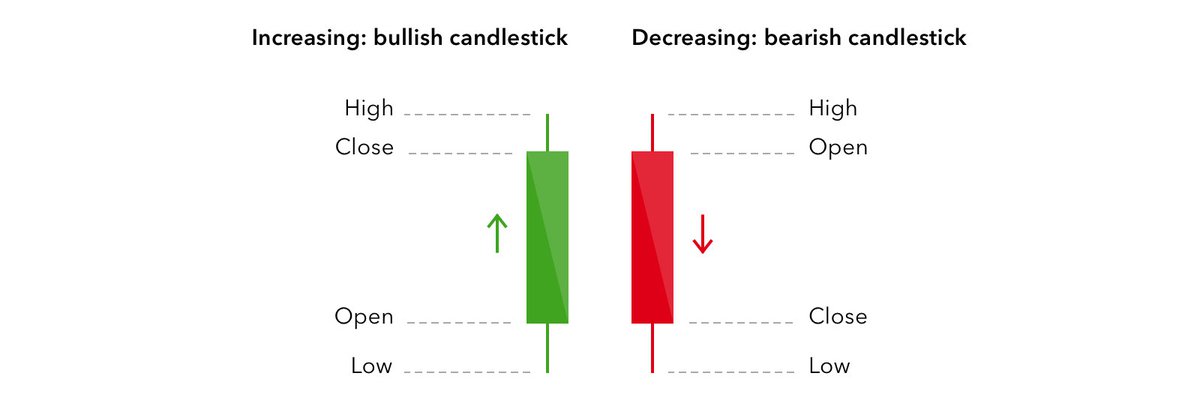
If you recall the example OHLCV row from the previous section, you can see each candlestick represents the open, high, low, close part of each row of data. Many technical trading strategies look for candlestick patterns, which we may explore in later articles.
An excellent book for learning some of these patterns is Technical Analysis for Financial Markets. For a brief overview, you can also view Investopedia's article, Understanding Basic Candlestick Charts
Now that we've seen an example of the data and understand each row's meaning, let's move on to configuring freqtrade to run our strategy.
Freqtrade Configuration
We have the required data for backtesting a strategy, but we need to create a config file, which will allow us to control several parameters of our strategy easily.
To create a new config, we run the following command:
docker-compose run --rm freqtrade new-config --config user_data/learndatasci-config.jsonYou will see a few initial questions, to which we answered with the following values:

Before continuing, we need to open the config file and set pair_whitelist = ["ETH/BTC"], which establishes our coin-pair of interest. Then we are ready to go.
You don't need to worry about anything else for the time being, but you should make sure to understand what the other configuration options mean, so be sure to visit the relevant docs.
Implementing a simple, custom strategy - Moving Average Crossover
Here, we will be defining a simple moving average strategy similar to the one in the Python for Finance series. If you haven't read that yet, make sure to checkout. You can find more details in Investopedia.
Understanding the strategy
I am going to tell you a little secret. Trading is really very simple, and you only have to do two things right:
- Buy Low
- Sell High
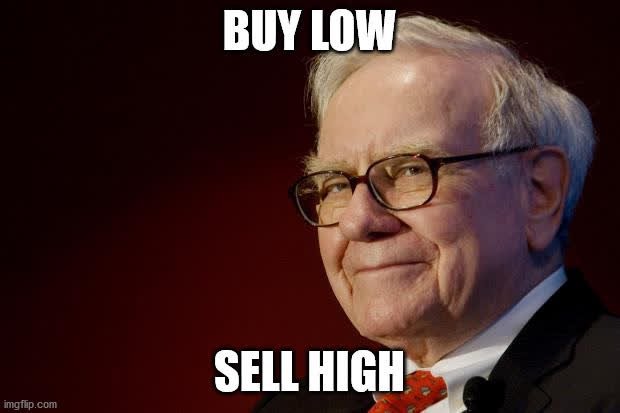
That easy? What's the catch? The tricky thing is to find the actual low and high points.
The idea behind the Moving Average strategy is the following:
- You have two lines
- The Slow Moving Average (SMA): a longer-term average of past values and represents a general trend.
- The Fast Moving Average (FMA): a shorter-term average of past values and represents the current trend.
For our strategy, we will use the following indicators:
- Buy when the FMA crosses above SMA, indicating an upward trend.
- Sell when the FMA crosses below SMA, indicating a downward trend.
This is called a Moving Average Crossover Strategy.
Defining a custom strategy for freqtrade
Let's translate the Moving Average Crossover strategy in freqtrade using pandas.
Firstly, we need to create a new strategy file that will hold the logic behind our buy/sell signals.
!docker-compose run --rm freqtrade new-strategy -s SimpleMA_strategy --template minimal`
Now, we can find the newly created file in the strategies folder:
ft_userdata
└───user_data
...
└───strategies
SimpleMA_strategy.pySimpleMA_strategy.py contains an autogenerated class, SimpleMA_strategy, and several functions we'll need to update.
To define our simple strategy, we need to update the following three functions:
populate_indicators()populate_buy_trend()populate_sell_trend()
Let's walk through each of these individually.
1. populate_indicators()
Here, we calculate the indicators needed by our strategy to produce buy/sell signals.
According to our strategy, we calculate the fast-moving average fast_MA (calculated using the last 5 candlesticks) and the slow-moving average slow_ma (calculated using the previous 50 candlesticks):
class SimpleMA_strategy(IStrategy):
...
def populate_indicators(self, dataframe: DataFrame, metadata: dict) -> DataFrame:
fast_period = 5
slow_period = 50
dataframe['fast_MA'] = ta.SMA(dataframe, timeperiod=fast_period)
dataframe['slow_MA'] = ta.SMA(dataframe, timeperiod=slow_period)
return dataframeNotice that we are passing a dataframe as an argument, manipulating it, then returning it. Working with dataframes in this way is what all of our functions will be doing.
If you're interested in seeing indicators other than simple moving averages, have a look at the ta-lib docs.
Note
The function definitions in this class use type hinting to define argument and return value types.
2. populate_buy_trend()
This function populates our buy signal, which is triggered when the fast_MA crosses above the slow_MA in our strategy.
We can accomplish this by updating populate_buy_trend() to include the following logic:
class SimpleMA_strategy(IStrategy):
...
def populate_indicators(...):
...
def populate_buy_trend(self, dataframe: DataFrame, metadata: dict) -> DataFrame:
dataframe.loc[
(
qtpylib.crossed_above(dataframe['fast_MA'], dataframe['slow_MA'])
),
'buy'] = 1
return dataframeUsing qtpylib, we can easily find the crossover point. Essentially, the code above populates the buy column with a 1 when our buy condition (crossed_above) is triggered.
3. populate_sell_trend()
In a similar fashion to the previous function, this function populates our sell signal.
According to our strategy, this is when the fast_MA crosses below the slow_MA.
class SimpleMA_strategy(IStrategy):
...
def populate_indicators(...):
...
def populate_buy_trend(...):
...
def populate_sell_trend(self, dataframe: DataFrame, metadata: dict) -> DataFrame:
dataframe.loc[
(
qtpylib.crossed_below(dataframe['fast_MA'], dataframe['slow_MA'])
),
'sell'
] = 1
return dataframeWe're now using crossed_below—the opposite of crossed_above—which will populate the sell column with a 1 when our sell condition is triggered.
By default, the generated freqtrade strategy file includes more options, such as ROI (Return On Investment) and stop-loss, discussed in part two of the article series. We'll disable them for now:
class SimpleMA_strategy(IStrategy):
...
# the following statement disables selling due to ROI
minimal_roi = {
"0": 100
}
# the following statement disables selling due to stop-loss
stoploss = -1.0
def populate_indicators(...):
...
def populate_buy_trend(...):
...
def populate_sell_trend(...):
...Now that we have a strategy filled out, we can test how it would have performed on past data.
Backtesting the strategy
Having defined our simple strategy, now we want to evaluate it using historical data using backtesting, which allows us to place trades in the past to see how they would have performed.
Backtesting isn't a perfect representation of how well our strategy would have performed because other factors affect returns in live markets, such as slippage.
To perform backtesting with freqtrade, we can run the following command using the class and functions we just created:
docker-compose run --rm freqtrade backtesting
--strategy SimpleMA_strategy -i 1d -p ETH/BTC
--timerange 20200101-20201231
--starting-balance 1
-c ./user_data/learndatasci-config.jsonThe parameters in the above command are as follows:
| Argument | Description |
|---|---|
--strategy SimpleMA_strategy | use the SimpleMA_strategy strategy we created above. |
-i 1d | use 1 day candlesticks |
-p ETH/BTC- trade the ETH/BTC coin pair, which trades our BTC for ETH--timerange 20200101-20201231- backtest for the year 2020, from its first day 01/01/2020 to its last day 12/31/2020.c ./user_data/config-learndatasci.jsonwe are using the configuration that we defined earlier in this article.--starting-balance 1we start with a balance of 1 BTC.
Result for strategy SimpleMA_strategy
========================================================== BACKTESTING REPORT ==========================================================
| Pair | Buys | Avg Profit % | Cum Profit % | Tot Profit BTC | Tot Profit % | Avg Duration | Win Draw Loss Win% |
|---------+--------+----------------+----------------+------------------+----------------+-------------------+-------------------------|
| ETH/BTC | 6 | 8.47 | 50.81 | 0.05086506 | 5.09 | 34 days, 12:00:00 | 3 0 3 50.0 |
| TOTAL | 6 | 8.47 | 50.81 | 0.05086506 | 5.09 | 34 days, 12:00:00 | 3 0 3 50.0 |
==================================================== SELL REASON STATS =====================================================
| Sell Reason | Sells | Win Draws Loss Win% | Avg Profit % | Cum Profit % | Tot Profit BTC | Tot Profit % |
|---------------+---------+--------------------------+----------------+----------------+------------------+----------------|
| sell_signal | 6 | 3 0 3 50.0 | 8.47 | 50.81 | 0.0508651 | 50.81 |
===================================================== LEFT OPEN TRADES REPORT ======================================================
| Pair | Buys | Avg Profit % | Cum Profit % | Tot Profit BTC | Tot Profit % | Avg Duration | Win Draw Loss Win% |
|--------+--------+----------------+----------------+------------------+----------------+----------------+-------------------------|
| TOTAL | 0 | 0.00 | 0.00 | 0.00000000 | 0.00 | 0:00 | 0 0 0 0 |
=============== SUMMARY METRICS ===============
| Metric | Value |
|-----------------------+---------------------|
| Backtesting from | 2020-01-01 00:00:00 |
| Backtesting to | 2020-12-31 00:00:00 |
| Max open trades | 1 |
| | |
| Total trades | 6 |
| Starting balance | 1.00000000 BTC |
| Final balance | 1.05086506 BTC |
| Absolute profit | 0.05086506 BTC |
| Total profit % | 5.09% |
| Trades per day | 0.02 |
| Avg. stake amount | 0.10000000 BTC |
| Total trade volume | 0.60000000 BTC |
| | |
| Best Pair | ETH/BTC 50.81% |
| Worst Pair | ETH/BTC 50.81% |
| Best trade | ETH/BTC 36.59% |
| Worst trade | ETH/BTC -10.57% |
| Best day | 0.03662727 BTC |
| Worst day | -0.01058107 BTC |
| Days win/draw/lose | 3 / 277 / 3 |
| Avg. Duration Winners | 51 days, 16:00:00 |
| Avg. Duration Loser | 17 days, 8:00:00 |
| Zero Duration Trades | 0.00% (0) |
| Rejected Buy signals | 0 |
| | |
| Min balance | 1.02441263 BTC |
| Max balance | 1.06732320 BTC |
| Drawdown | 16.44% |
| Drawdown | 0.01645814 BTC |
| Drawdown high | 0.06732320 BTC |
| Drawdown low | 0.05086506 BTC |
| Drawdown Start | 2020-09-10 00:00:00 |
| Drawdown End | 2020-12-19 00:00:00 |
| Market change | 24.93% |
===============================================We get a full report that contains the results of all our trades during the specified period.
Freqtrade split's the report into four parts:
1. Backtesting report This section shows a performance report for every coin pair, which in our case, is only ETH/BTC.
The column Avg Profit % shows the average profit for all trades made while the column Cum Profit % sums up all the profits/losses. The column Tot Profit % shows instead the total profit % in relation to the starting balance. ~ freqtrade docs
2. Sell reason stats This report shows us the performance of the sell reasons. Based on our strategy, we only used the sell signal, so we only have 1 row. Generally, we could also sell for other reasons such as accepted Return On Investment (ROI) and stop-loss. We will see this in the next article of the series.
3. Left Open Trades Report This part of the report shows any trades that were left open at the end of the backtesting. In our case, we don't have any and in general, it is not very important as it represents the ending state of the backtesting.
4. Summary metrics Personally, this is the area I usually look at first. The most important parts to point out are the following:
- Trades per day - the average number of closed trades per day. I'm usually looking for strategies that make about ten trades per day.
- Total profit % - the profit as a percentage of the starting balance.
- Drawdown - the amount of the largest continuous loss
- Market change - how much the market grew/shrank at the specified period. When trading more than one coin-pair, this metric is the average of market changes that all pairs incur, from the beginning to the end of the specified period. In our case the market for ETH/BTC grew by 24.93% in 2020. It's crucial to test a strategy in different market conditions, not just upward trending markets.
To understand the report in its entirety, make sure to read the relevant docs.
Notes and improvements
We can see that only six trades occurred. These trades generated a profit of 5.09%, which started with 1 BTC and ended with 1.05086506 BTC.
This result is not impressive, considering the risk involved. However, this strategy is as simple as it gets and has vast room for improvement:
Comparing to buy and hold Just holding ETH, i.e., converting our entire stack of BTC to ETH at the beginning of the testing period, we would gain 24.93% (market change indicator), but this is not something we can generally expect. We had far less exposure staking 10% of our stack per trade and not the whole of it. It is important to test our strategy in different conditions - that is not only when the market is growing, but also when it is shrinking.
Trading more coin-pairs We only considered Ethereum, which is one of the hundreds of coins we can trade. This limit only allows for one trade to happen at a time, which is clearly suboptimal.
Using more advanced strategies We used arguably one of the simplest strategies out there, which used only simple moving averages as indicators. Adding complexity doesn't necessarily mean better performance, but there's a massive number of indicator combinations we can backtest against eachother to find the best strategy.
Optimizing parameters Currently, we haven't attempted to optimized any hyperparameters, such as moving average period, return of investment, and stop-loss.
Smaller time periods We only considered daily candlesticks, which is one of the reasons why the bot finds only about 0.02 trades per day, making far fewer trades than a human trader. A bot can potentially make more profit by making more frequent trades and looking at more fine-detailed candlesticks.
Plotting results
To utilize freqtrade's plot commands, we will need to alter the docker-compose.yml file. The only thing we need to do is comment out one line and uncomment another. See the following excerpt from the file to see an example:
---
version: '3'
services:
freqtrade:
# image: freqtradeorg/freqtrade:stable <--- comment this line
# image: freqtradeorg/freqtrade:develop
# Use plotting image
image: freqtradeorg/freqtrade:develop_plot <--- uncomment this line
...This tells docker-compose to pull the freqtrade Docker image that contains the correct plotting libraries.
We can now visualize our data, indicators, and buy/sell signals using the freqtrade plot-dataframe command.
docker-compose run --rm freqtrade plot-dataframe -s SimpleMA_strategy --config ./user_data/learndatasci-config.json -i 1d --timerange 20200101-20201231 --indicators1 fast_MA slow_MAThe --indicators1 option defines the indicators we want to plot, namely fast_MA and slow_MA. These must be defined inside the strategy specified with the -s option.
By default, this creates a plotly html file available in the plot directory: ./user_data/plot/freqtrade-plot-ETH_BTC-1d.html
ft_userdata
└───user_data
...
└───plot
freqtrade-plot-ETH_BTC-1d.htmlYou can view a full version of this interactive plot here.
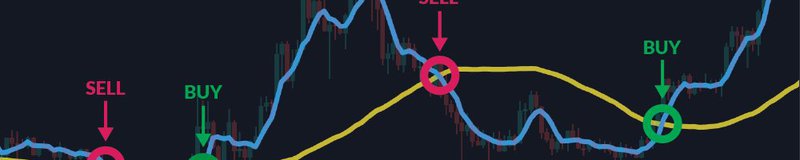
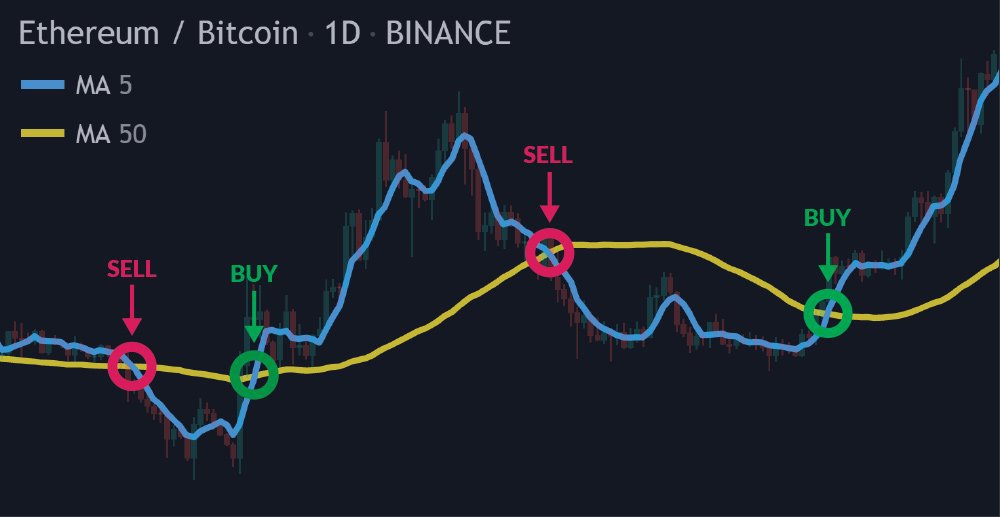
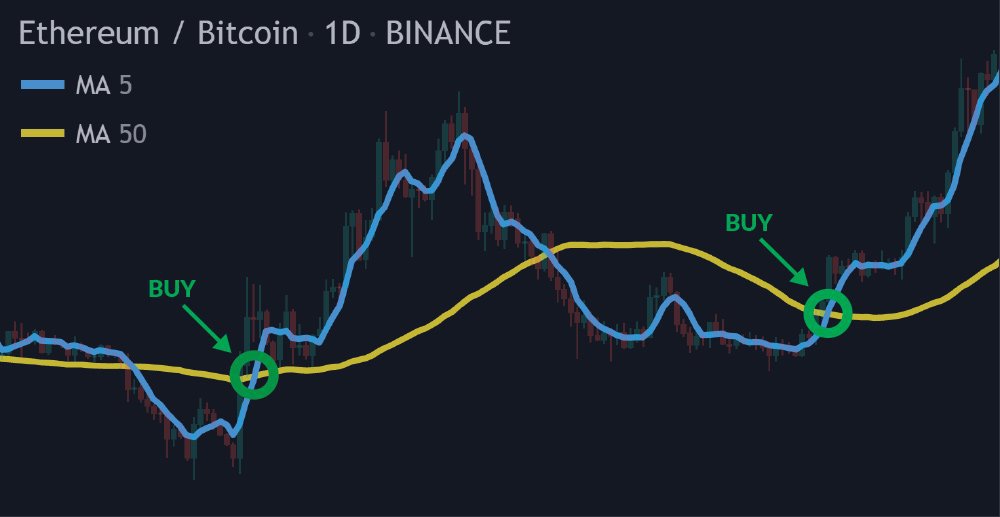
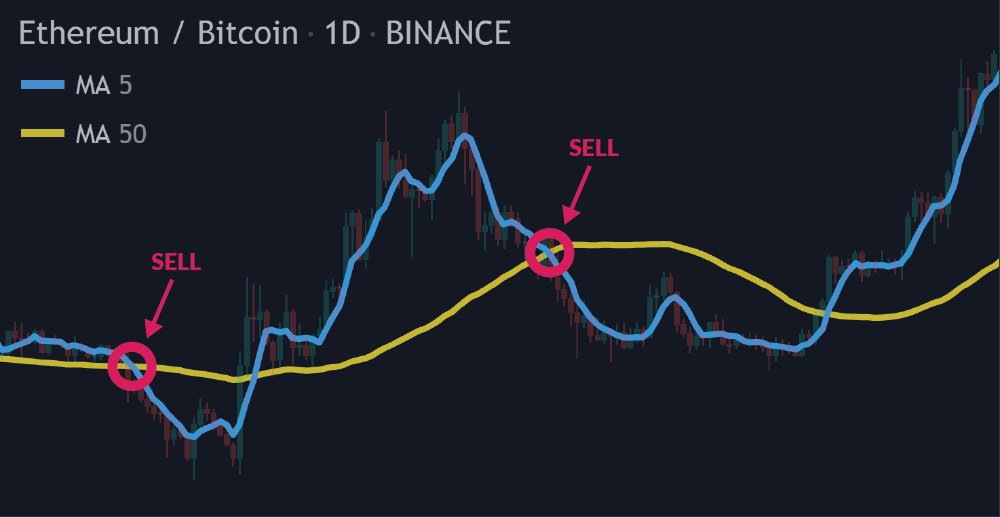
Hover over the plot to see how the bot actually does what we wanted it to do, as defined by our simple moving average strategy:
- Buy when
fast_MAcrosses belowslow_MA. - Sell when
fast_MAcrosses aboveslow_MA.
To see what else you can do with plot-dataframe, run docker-compose run --rm freqtrade plot-dataframe -h or visit the relevant docs.
Discussion
In this article, we've seen just a glimpse of what we can do with freqtrade:
- Define custom strategies using pandas.
- Backtest them using historical data and generate relevant reports.
- Plot results and visualize the simulated trades using plotly.
Follow us in the following article for more advanced usage of freqtrade, where we:
- Add more coin pairs to trade with,
- Discuss Return On Investment (ROI) and stop-loss and how to define them properly.
- Optimize our strategy with hyperopt,
- Deploy a live trading bot, and
- Discuss more advanced ways to improve.
Acknowledgement
I want to acknowledge freqtrade's helpful, well-written documentation, from which this article has taken much inspiration. I'd like to thank the developers for their effort in creating such an fantastic tool for all of us to use.
Make sure to read more of the official freqtrade docs.
Meet the Authors

MEng in Electrical and Computer Engineering from NTUA Athens. MSc in Big Data Management and Analytics from ULB Brussels, UPC Barcelona and TUB Berlin. Has software engineering experience working at the European Organization for Nuclear Research (CERN). Currently he is working as a Research Data Scientist on a Deep Learning based fire risk prediction system.

Founder of LearnDataSci