
Founder of LearnDataSci
The 5 Best Courses to Learn Data Analytics for 2026
LearnDataSci is reader-supported. When you purchase through links on our site, earned commissions help support our team of writers, researchers, and designers at no extra cost to you.
The increasing demand for data analysts has spurred a proliferation of data-related courses. However, many of these programs do not offer a well-rounded learning experience that covers all the essential analytics skills.
For this article, I've sifted through the best online course platforms to find the best classes for learning data analytics. Since many skills are involved in an analyst's job, I've provided the best course option for specific categories. Hopefully, this categorization will help you more easily decide which course is the best for you.
Go from side-hustling to earning enough to quit your job.
Use code sdgd3 for 50% off. Check it out →
If you're still having trouble picking a course, feel free to check out the Learning Guide at the end of this article for information about what data analysts do, what skills they need, and recommendations on how to get started.
Course selection criteria
There're thousands of data courses these days, so to narrow down the options to only the most qualified, I considered the following data points:
- Organization and quality of content
- Student reviews
- Staff and student discussions
- Quizzes and assignments
- Inclusion of statistical concepts
These criteria helped reduce the number of potential courses to only a handful, of which I then compared and contrasted to bring you my recommendations listed below. These final few are what I found to be the best for learning data analytics online today.
TL;DR Best Data Analytics courses for 2026
| Rank | Course Title | Platform | Tech | Rating | Pricing | Level |
|---|---|---|---|---|---|---|
| 1 | Google Data Analytics Professional Certificate | Coursera | Google Sheets, SQL | 4.8 | Free-$49/month | Beginner |
| 2 | Become a Data Analyst | Linkedin Learning | Excel, Power BI, SQL, Tableau, R | 4.7 | $39.99/month | Beginner to Intermediate |
| 3 | Excel Skills for Data Analytics and Visualization Specialization | Coursera | Excel | 4.8 | Free-$49/month | Intermediate |
| 4 | Data Analyst in R | Dataquest | R, SQL | 4.8 | $25-49/month | Beginner |
| 5 | Business and Data Analysis with SQL | Skillshare | SQL | 4.9 | $13.99/month | Beginner-Intermediate |
Google Data Analytics Professional Certificate — Google, Coursera
| Tech | Rating | Pricing | Level | Course Link |
|---|---|---|---|---|
| Google Sheets, SQL, R, Tableau | 4.8 | Free-$39.99/month | Beginner | Enroll |
Best for:
Complete beginners looking for a broad introduction to data analytics focused on Google products.
Overview:
This highly-rated course from Google covers a wide range of topics and is designed to "have you job-ready in less than six months," according to their description. Google states that certificate holders will have access to an Employer Consortium, which comprises 150 U.S. companies committed to considering graduates for entry-level analytics positions.
Out of all the courses I could find, this series by Google is the most comprehensive. The course video content is well-organized, professional, and exciting, and with so many students enrolled, there's an active community for questions and answers. Through the course, you're exposed to the most popular analytics tools: Google Sheets, SQL, R, and Tableau. These topics cover the entire data analytics pipeline and give you the skills to develop your own projects.
Syllabus:
Course 1: Foundations: Data, Data, Everywhere
- Intro to data analytics
- Intro to analytics tools (Sheets, SQL)
Course 2: Ask Questions to Make Data-Driven Decisions
- Problem-solving
- Asking good questions
- Spreadsheet basics
- Communicating effectively
Course 3: Prepare Data for Exploration
- Data formats, types, modeling, collection
- Data ethics
- Using spreadsheets with databases
- Intro to BigQuery
- Data security
Course 4: Process Data from Dirty to Clean
- Data integrity
- Data cleaning with spreadsheets and SQL
- Resume/career info
Course 5: Analyze Data to Answer Questions
- Organizing data for Sheets and Bigquery
- Formatting and transforming data
- Data aggregation functions in Sheets and SQL
- More formulas, functions, and pivot tables
- Intermediate SQL
Course 6: Share Data Through the Art of Visualization
- Intro to data visualization concepts
- Creating visualizations with Tableau
- Developing data stories
- Creating effective presentations
Course 7: Data Analysis with R Programming
- Intro to the R language and RStudio
- Cleaning, organizing, and transforming data with R
- Creating visualizations with R
- Making reports and docs for R analyses
Course 8: Google Data Analytics Capstone: Complete a Case Study
- Developing your own project to display in your portfolio and resume
- Info on building a compelling portfolio
The curriculum is divided into "courses," but some of the content can be completed far shorter than a typical Coursera course. Some learners report they completed the entire Specialization in under a month. So, depending on your background, you may well finish the course series quicker than advertised.
Enroll in the Google Data Analytics Professional Certificate
Become a Data Analyst — Linkedin Learning
| Tech | Rating | Pricing | Level | Course Link |
|---|---|---|---|---|
| Excel, Power BI, SQL, Tableau, R | 4.7 | $39.99/month | Beginner to Intermediate | Enroll |
Best for:
Those looking for broad exposure to many data analytics tools, but with more of a focus on Microsoft products
Overview:
The data analyst learning path from Linkedin Learning in a collection of courses organized in a way that provides you with a well-rounded education. The course path is similar in scope to that of Google's listed above, but focusing on Microsoft products, namely Excel and Power BI.
One benefit to this course series over Google's is the inclusion of statistics modules, which is excellent for learners that would like to strengthen their math for analytics.
Syllabus:
Course 1: The Non-Technical Skills of Effective Data Scientists
- Imperative non-technical skills
Course 2: Learning Excel: Data Analysis
- Basic statistics in Excel
- Visualizing data
- Hypothesis testing
- Using distributions
- Covariance and correlation
- Bayesian analysis
Course 3: Data Fluency: Exploring and Describing Data
- Data fluency
- How to use the most common chart types
- Descriptive statistics
Course 4: Learning Data Analytics: 1 Foundations
- Basic SQL
- Importing and cleaning data
- Creating and maintaining datasets
- Intro to Power Query
Course 5: Learning Data Analytics Part 2: Extending and Applying Core Knowledge
- Working with business data
- Building datasets with queries
- Building pivot tables
- Intro to Power BI
- Presenting data in meetings
Course 6: Excel Statistics Essential Training: 1
- Types of data
- Probability
- Central tendency
- Variability
- Distributions
- Estimation
- Hypothesis testing
- Analysis of variance (ANOVA)
- Repeated measure analysis
- Regression
- Correlation
Course 7: Predictive Analytics Essential Training: Data Mining
- Defining problems
- Understanding data requirements
- Problems and solutions you'll face with data
- Deploying models
- Cross-Industry Standard for Data Mining (CRISP-DM)
Course 8: Power BI Essential Training
- Getting data into Power BI
- Reports and visualizations
- Creating dashboards
- Sharing data
- Power BI mobile
Course 9: Learning Data Visualization
- Information hierarchy
- Storytelling
- Visual paradigms
- Interactivity
Course 10: Tableau Essential Training
- Managing data sources
- Tableau worksheets and workbooks
- Creating custom calculations and fields
- Analyzing data in Tableau
- Mapping geographic data
- Creating dashboards and actions
Course 11 SQL: Data Reporting and Analysis
- Using SQL to report data
- Grouping SQL results
- Merging data
- Some advanced syntax
Course 12: R Essential Training: Wrangling and Visualizing Data
- Intro to R and RStudio
- Importing data
- Visualizing data in R
- Wrangling data
- Recoding data
Course 13 Data Cleaning in Python Essential Training
- Bad data
- Causes of errors
- Detecting, preventing, and fixing errors
You can acquire many in-demand skills from the data analyst path on Linkedin Learning. There is some overlap with the statistics and visualization content, but for a beginner, this can only reinforce your newly acquired analytics skills as a beginner.
The one gripe I have with this path is that the Python course at the end already assumes Python experience, but nowhere in the path is there a Python syntax course. If you intend to complete this path, I'd also recommend learning Python syntax on Codecademy, the top Python course according to the data.
Enroll in the Become a Data Analystpath
| Tech | Rating | Pricing | Level | Course Link |
|---|---|---|---|---|
| Excel, Power BI | 4.8 | $49/month | Intermediate | Enroll |
Best for:
Those with some Excel experience looking to analyze data as fast as possible.
Overview:
This course from Macquarie University covers many of Excel's intermediate to advanced concepts, allowing you to clean, analyze, and visualize data efficiently. If you're rusty on statistics, it may be a good idea to complement this course with an appropriate statistics course since the math side of analytics isn't covered here.
Overall, the quality of instruction is fantastic, and you'll find plenty of assessments and assignments to hone your Excel and Power BI skills.
Syllabus:
Course 1: Excel Fundamentals for Data Analysis
- Cleaning and manipulating text
- Working with numbers and dates
- Defined Names
- Tables for automating data manipulation
- Logical and lookup functions
Course 2: Data Visualization in Excel
- Conditional formatting, sparklines, and number formats
- Various charting techniques
- Specialized charts
- Interactive dashboards using pivot charts, slicers, and dynamic charts
Course 3: Excel Power Tools for Data Analysis
- Get and transform data with Power Query
- Power Pivot and data models
- Visualize data with Power BI
Once you've completed this course and are comfortable analyzing data in Excel, it may make sense to start learning SQL or R. For SQL, see the previous course; for R see the following course.
Enroll in Excel Skills for Data Analytics and Visualization Specialization
Data Analyst in R— Dataquest
| Tech | Rating | Pricing | Level | Course Link |
|---|---|---|---|---|
| R, SQL | 4.8 | $25-$49/month | Beginner | Enroll |
Best for:
Beginners who are more interested in the programming side of data analytics, as opposed to a spreadsheet software, like Excel.
Overview
Dataquest is one of the most popular interactive data science learning platforms. Despite not having videos for each topic, their teaching methodology and project-based learning style are very effective.
The Data Analyst with R path, which also has a Python version, brings learners with no programming experience through the entire analytics pipeline using R and SQL.
Python is often the first choice for working with data, but if your goal is to become proficient in analytics, R plays more nicely with data and statistics out of the box. The language's straightforwardness lets you be productive with data faster than Python in many cases.
Syllabus:
- Intro to R syntax
- Data structures
- Loops, iterations, functions, and control flow
- Data visualization
- Data cleaning
- SQL fundamentals
- Intermediate SQL
- Getting data from APIs and web scraping in R
- Beginner to intermediate statistics using R
- Probability fundamentals and conditional probability
- Hypothesis testing
- Linear regression
- Machine learning fundamentals
- Interactive web apps with R
Dataquest has a much stronger curriculum in statistics and probability than other courses, so if you feel like your math needs work, this course path will help. Furthermore, Dataquest can also serve as a great resource for practicing your skills through their guided projects, regardless of which other course you decide to take.
Enroll in the Data Analyst in R path
Business and Data Analysis with SQL — Skillshare
| Tech | Rating | Pricing | Level | Course Link |
|---|---|---|---|---|
| SQL | 4.9 | $13.99/month | Beginner-Intermediate | Enroll |
Best for:
Those who are more interested in learning and applying SQL to analytics, or anyone wishing to expand past spreadsheets
Overview:
Geoff Devitt, the instructor for this course, is a 20+ year veteran of the Big Data industry and created this Skillshare class to share what he's learned building projects and analyzing data over his career.
Unlike other courses mentioned in this list, this course focuses solely on solving analytics problems using Structured Query Language (SQL), a programming language built to interface with databases. Since SQL runs many businesses, it was one of the most highly requested skills mentioned in job posts during my research for this article.
Syllabus:
- Intro to databases
- Normalizing data
- Fact tables
- Aggregating data
- Entity Relationship Diagrams (ERD)
- Setting up and connecting to MySQL
- Beginner to intermediate SQL
- Data analysis example project
- Query explain plans
- MySQL administration
Once you've finished this course, you should be reasonably comfortable with SQL and can start working on your portfolio projects.
Enroll in Business and Data Analysis with SQL
Learning guide
What do data analysts do?
Data analysts' responsibilities vary widely from company to company, but most have the following primary objectives: 1) Pull data from a variety of sources, such as databases, Excel workbooks, and CSVs 2) Apply statistical analysis to the data 3) Condense information into easily digestible formats 4) Create visualizations, summary reports, and dashboards
A data analyst creates value for a company by helping them make better decisions and, ultimately, to generate more revenue.
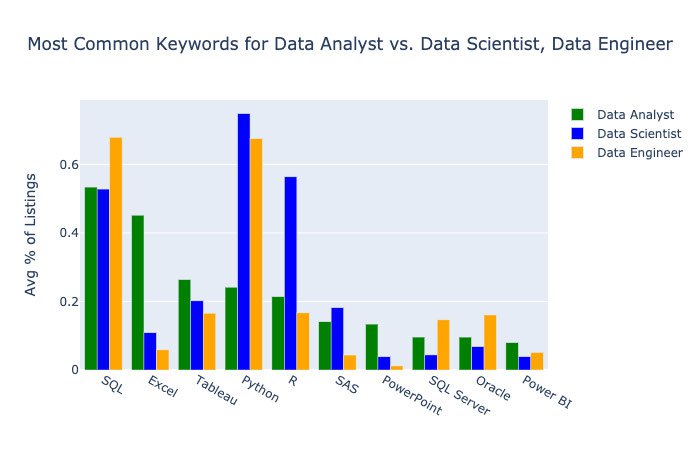
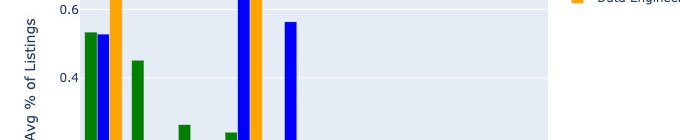
Data Analyst vs. Data Scientist
Becoming a data scientist often starts with first becoming a data analyst. If we were to look at a Venn diagram of the skillsets of both roles, the data scientist's circle would fully encompass the data analyst's.
The Northeastern University blog sums up the differences nicely:
While data analysts and data scientists both work with data, the main difference lies in what they do with it.
Data analysts examine large data sets to identify trends, develop charts, and create visual presentations to help businesses make more strategic decisions.
Data scientists, on the other hand, design and construct new processes for data modeling and production using prototypes, algorithms, predictive models, and custom analysis.
Essentially, data analysts work with established data and pipelines to draw insight, while data scientists create new data pipelines and use more advanced tools and techniques to solve more complex problems.
Data analyst tools and skills
Data analysts use various tools and processes, so the courses you take will depend on your desired position and what knowledge you already have. One company may need an analyst primarily for Excel and Power BI, while another business needs someone with SQL and Tableau experience.
If you're coming into data analytics with no programming experience, your quickest path to job-ready would be to build proficiency in a spreadsheet program like Excel or Google Sheets and visualization software, such as Tableau or Google Data Studio.
Alternatively, if you have any programming experience, starting with SQL, Python, or R would be a good choice. Most job posts mention SQL, so if that's your primary interest, feel free to check out my picks for the best SQL courses, which rank the best courses for learning SQL in general. In this article, I focus my SQL suggestions primarily on using SQL for analytics.
Which technology (Excel, SQL, Tableau, etc.) do I start with?
Learning Excel is one of the best ways to get started in data analytics since many people already have exposure to the software. You can more easily build on this familiarity through an Excel-specific course, like Excel Skills for Data Analytics and Visualization Specialization from Coursera.
Despite using Python to analyze data for years, I still reach for Excel when I need to do a quick analysis, share results with the team, and make educated decisions. Many companies still run their entire analytics pipeline through Excel, so many job opportunities are awaiting skilled Excel data analysts.
Knowing more about Excel (or Google Sheets) can only benefit you in analytics, but if you already have a decent Excel foundation, going on to SQL would be a safe bet. Many businesses store their data in a SQL database and need analysts to pull, summarize, and make sense of that data. When researching job posts for this article, I found more jobs requiring someone with solid SQL experience than any other technology.
Since SQL is a programming language, it makes sense that most SQL courses focus solely on syntax and data modeling, which is why I've included Business and Data Analysis with SQL here since it has more of an analytics approach.
Finally, if you already have some spreadsheet experience and would rather move on to programming language with more applications, then learning R is an excellent choice. Unlike SQL, which is confined to databases, R is a regular programming language with many advantages in statistics and visualization. R is more straightforward than Python for pure analytics work, but Python skills are still in high-demand. Either way, I would recommend working through the free R or Python material on Dataquest to start learning as quickly as possible.
Apply what you learn
No matter which skill, technology, or path you start, it's imperative you practice everything you learn. Solidify your knowledge by analyzing something you're interested in, and produce reports or dashboards to display your findings. Many employers consider unique, completed projects an equivalent replacement for work experience. Not only does talking through a passion project you've completed aid interviewers with gauging your abilities, but it also helps you escape imposter syndrome and build self-confidence.
Are certificates worth it?
Every course in this list offers a certificate, and they are a fantastic way to prove to yourself that you completed a course and solidified knowledge of a topic. Despite that, you should approach building your resume as if the certificates you earn don't exist. You should focus solely on building projects that demonstrate your knowledge and aptitude, especially when you lack past job experience.
Pick a niche you're interested in, whether it's sports, finance, health, or marketing, and build something that interests you. It doesn't have to be groundbreaking, but it should showcase your abilities to interviewers. If you're looking for inspiration, check out Kaggle datasets and community notebooks, or follow a few of the Dataquest or Coursera guided projects.
Good luck, have fun!
Learning data analytics can be a challenging journey, but whether for a career or hobby, I'm confident analytics will lead you down a path of exciting projects, tangents, and fortuitous findings.