
Ph.D. in Computer Engineering, Data Scientist
Gini Impurity
A measurement used to build Decision Trees to determine how the features of a dataset should split nodes to form the tree.
What is Gini Impurity?
Gini Impurity is a measurement used to build Decision Trees to determine how the features of a dataset should split nodes to form the tree. More precisely, the Gini Impurity of a dataset is a number between 0-0.5, which indicates the likelihood of new, random data being misclassified if it were given a random class label according to the class distribution in the dataset.

For example, say you want to build a classifier that determines if someone will default on their credit card. You have some labeled data with features, such as bins for age, income, credit rating, and whether or not each person is a student. To find the best feature for the first split of the tree – the root node – you could calculate how poorly each feature divided the data into the correct class, default ("yes") or didn't default ("no"). This calculation would measure the impurity of the split, and the feature with the lowest impurity would determine the best feature for splitting the current node. This process would continue for each subsequent node using the remaining features.
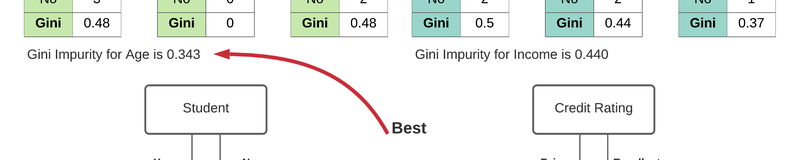
In the image above, $age$ has minumum gini impurity, so $age$ is selected as the root in the decision tree.
Mathematical definition
Consider a dataset $D$ that contains samples from $k$ classes. The probability of samples belonging to class $i$ at a given node can be denoted as $p_i$. Then the Gini Impurity of $D$ is defined as: $$ Gini(D) = 1- \sum_{i=1}^k p_{i}^{2} $$
The node with uniform class distribution has the highest impurity. The minimum impurity is obtained when all records belong to the same class. Several examples are given in the following table to demonstrate the Gini Impurity computation.
| Count | Probability | Gini Impurity | |||
|---|---|---|---|---|---|
| $n_1$ | $n_2$ | $p_1$ | $p_2$ | $1-p_1^2- p_2^2$ | |
| Node A | 0 | 10 | 0 | 1 | $1-0^2-1^2 = 0$ |
| Node B | 3 | 7 | 0.3 | 0.7 | $$1-0.3^2-0.7^2 = 0.42$$ |
| Node C | 5 | 5 | 0.5 | 0.5 | $1-0.5^2-0.5^2 = 0.5$ |
An attribute with the smallest Gini Impurity is selected for splitting the node.
If a data set $D$ is split on an attribute $A$ into two subsets $D_1$ and $D_2$ with sizes $n_1$ and $n_2$, respectively, the Gini Impurity can be defined as:
$$ Gini_{A} (D) = \frac {n_1}{n} Gini(D_1) + \frac {n_2}{n} Gini(D_2) $$
When training a decision tree, the attribute that provides the smallest $Gini_{A}(D)$ is chosen to split the node.
In order to obtain information gain for an attribute, the weighted impurities of the branches is subtracted from the original impurity. The best split can also be chosen by maximizing the Gini gain. Gini gain is calculated as follows: $$ \triangle Gini(A) = Gini(D)- Gini_A(D) $$
Python Example
# Import libraries
import numpy as np
import pandas as pd
import os
import matplotlib.pyplot as pltVisualizing Gini Impurity range
For a two class problem, Graph of impurity measures as a function of probability of the first class.
#A figure is created to show Gini ımpurity measures
plt.figure()
x = np.linspace(0.01,1)
y = 1 - (x*x) - (1-x)*(1-x)
plt.plot(x,y)
plt.title('Gini Impurity')
plt.xlabel("Fraction of Class k ($p_k$)")
plt.ylabel("Impurity Measure")
plt.xticks(np.arange(0,1.1,0.1))
plt.show()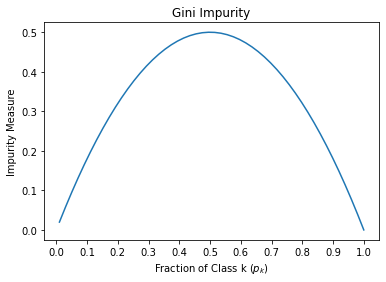
This figure shows that Gini impurity is maximum for the 50-50 sample ($p_1=0.5$ ) and minimum for the homogeneous sample ($p_1=0$ or $p_1=1$)
Computation of Gini Impurity for a simple dataset
This data set is used to predict whether a person will default on their credit card. There are two classes ( default = 'yes', no_default = 'no' ):
# Defining a simple dataset
attribute_names = ['age', 'income','student', 'credit_rate']
class_name = 'default'
data1 ={
'age' : ['youth', 'youth', 'middle_age', 'senior', 'senior', 'senior','middle_age', 'youth', 'youth', 'senior', 'youth', 'middle_age','middle_age', 'senior'],
'income' : ['high', 'high', 'high', 'medium', 'low', 'low', 'low', 'medium','low', 'medium', 'medium', 'medium', 'high', 'medium'],
'student' : ['no','no','no','no','yes','yes','yes','no','yes','yes','yes','no','yes','no'],
'credit_rate' : ['fair', 'excellent', 'fair', 'fair', 'fair', 'excellent', 'excellent', 'fair', 'fair', 'fair','excellent', 'excellent', 'fair', 'excellent'],
'default' : ['no', 'no', 'yes', 'yes', 'yes', 'no', 'yes', 'no', 'yes', 'yes','yes', 'yes', 'yes', 'no']
}
df1 = pd.DataFrame (data1, columns=data1.keys())
print(df1)age income student credit_rate default
0 youth high no fair no
1 youth high no excellent no
2 middle_age high no fair yes
3 senior medium no fair yes
4 senior low yes fair yes
5 senior low yes excellent no
6 middle_age low yes excellent yes
7 youth medium no fair no
8 youth low yes fair yes
9 senior medium yes fair yes
10 youth medium yes excellent yes
11 middle_age medium no excellent yes
12 middle_age high yes fair yes
13 senior medium no excellent no# STEP 1: Calculate gini(D)
def gini_impurity (value_counts):
n = value_counts.sum()
p_sum = 0
for key in value_counts.keys():
p_sum = p_sum + (value_counts[key] / n ) * (value_counts[key] / n )
gini = 1 - p_sum
return gini
class_value_counts = df1[class_name].value_counts()
print(f'Number of samples in each class is:\n{class_value_counts}')
gini_class = gini_impurity(class_value_counts)
print(f'\nGini Impurity of the class is {gini_class:.3f}')Number of samples in each class is:
yes 9
no 5
Name: default, dtype: int64
Gini Impurity of the class is 0.459# STEP 2:
# Calculating gini impurity for the attiributes
def gini_split_a(attribute_name):
attribute_values = df1[attribute_name].value_counts()
gini_A = 0
for key in attribute_values.keys():
df_k = df1[class_name][df1[attribute_name] == key].value_counts()
n_k = attribute_values[key]
n = df1.shape[0]
gini_A = gini_A + (( n_k / n) * gini_impurity(df_k))
return gini_A
gini_attiribute ={}
for key in attribute_names:
gini_attiribute[key] = gini_split_a(key)
print(f'Gini for {key} is {gini_attiribute[key]:.3f}')Gini for age is 0.343
Gini for income is 0.440
Gini for student is 0.367
Gini for credit_rate is 0.429# STEP 3:
# Compute Gini gain values to find the best split
# An attribute has maximum Gini gain is selected for splitting.
min_value = min(gini_attiribute.values())
print('The minimum value of Gini Impurity : {0:.3} '.format(min_value))
print('The maximum value of Gini Gain : {0:.3} '.format(1-min_value))
selected_attribute = min(gini_attiribute.keys())
print('The selected attiribute is: ', selected_attribute)The minimum value of Gini Impurity : 0.343
The maximum value of Gini Gain : 0.657
The selected attiribute is : ageThe figure at the top of this page corresponds to this example.
Meet the Authors

Associate Professor of Computer Engineering. Author/co-author of over 30 journal publications. Instructor of graduate/undergraduate courses. Supervisor of Graduate thesis. Consultant to IT Companies.